Yugoslavian vs Slovene Kindergarten
COMPARE
Yugoslavian
Slovene
Kindergarten
Kindergarten Comparison
Yugoslavians
Slovenes
98.2%
KINDERGARTEN
95.5/ 100
METRIC RATING
118th/ 347
METRIC RANK
98.7%
KINDERGARTEN
100.0/ 100
METRIC RATING
12th/ 347
METRIC RANK
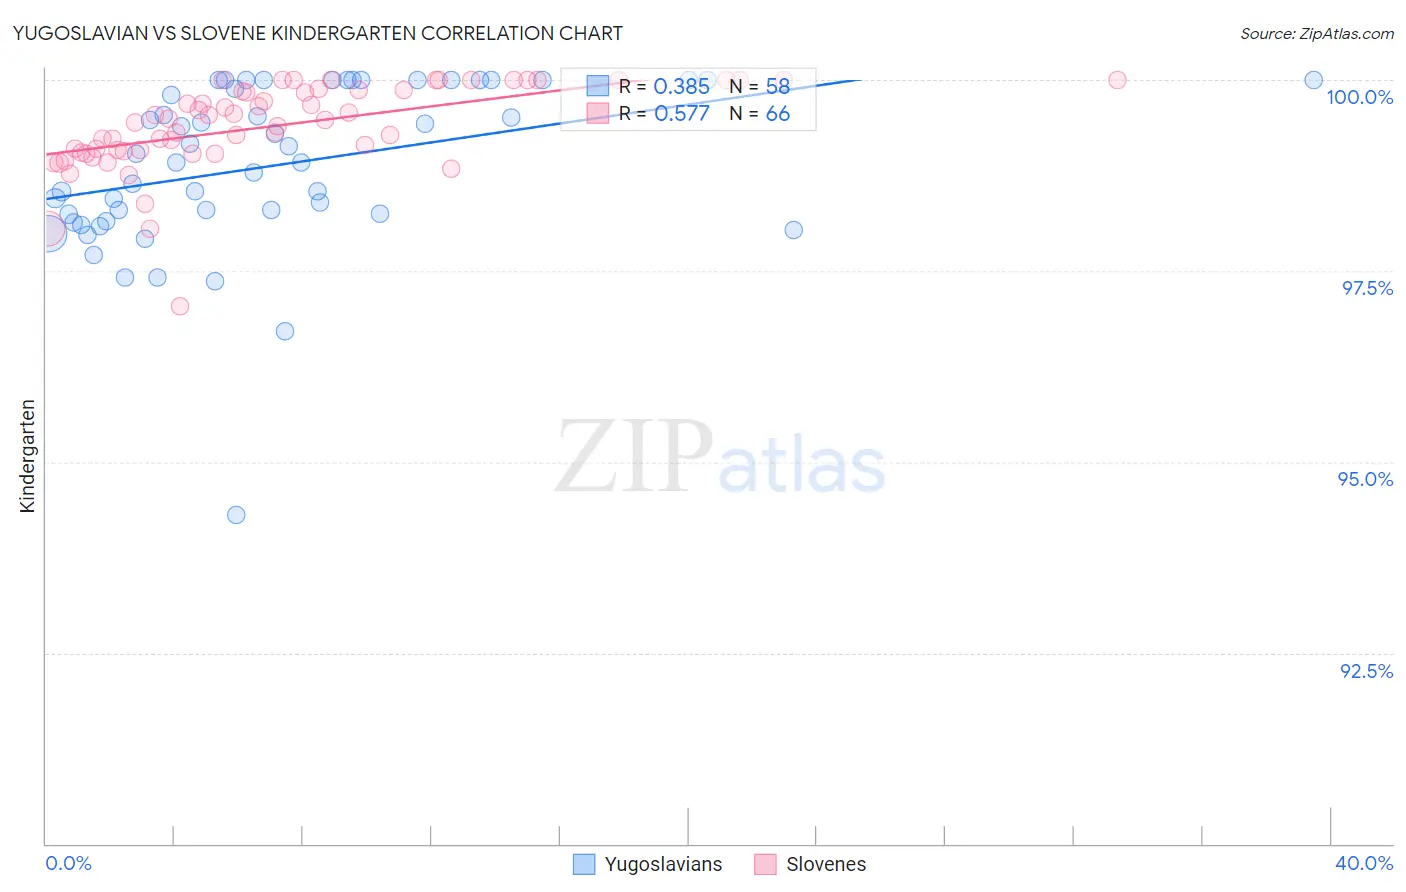
Yugoslavian vs Slovene Kindergarten Correlation Chart
The statistical analysis conducted on geographies consisting of 285,681,276 people shows a mild positive correlation between the proportion of Yugoslavians and percentage of population with at least kindergarten education in the United States with a correlation coefficient (R) of 0.385 and weighted average of 98.2%. Similarly, the statistical analysis conducted on geographies consisting of 261,353,374 people shows a substantial positive correlation between the proportion of Slovenes and percentage of population with at least kindergarten education in the United States with a correlation coefficient (R) of 0.577 and weighted average of 98.7%, a difference of 0.51%.
Kindergarten Correlation Summary
| Measurement | Yugoslavian | Slovene |
| Minimum | 94.3% | 97.0% |
| Maximum | 100.0% | 100.0% |
| Range | 5.7% | 3.0% |
| Mean | 98.9% | 99.4% |
| Median | 99.0% | 99.5% |
| Interquartile 25% (IQ1) | 98.2% | 99.1% |
| Interquartile 75% (IQ3) | 100.0% | 99.9% |
| Interquartile Range (IQR) | 1.8% | 0.81% |
| Standard Deviation (Sample) | 1.1% | 0.57% |
| Standard Deviation (Population) | 1.1% | 0.56% |
Similar Demographics by Kindergarten
Demographics Similar to Yugoslavians by Kindergarten
In terms of kindergarten, the demographic groups most similar to Yugoslavians are Immigrants from France (98.2%, a difference of 0.0%), Iranian (98.2%, a difference of 0.010%), Spanish (98.2%, a difference of 0.010%), Thai (98.2%, a difference of 0.010%), and Immigrants from Norway (98.2%, a difference of 0.020%).
| Demographics | Rating | Rank | Kindergarten |
| Immigrants | Norway | 96.6 /100 | #111 | Exceptional 98.2% |
| Immigrants | Czechoslovakia | 96.6 /100 | #112 | Exceptional 98.2% |
| Immigrants | Latvia | 96.3 /100 | #113 | Exceptional 98.2% |
| Ute | 96.3 /100 | #114 | Exceptional 98.2% |
| Iranians | 96.2 /100 | #115 | Exceptional 98.2% |
| Spanish | 95.8 /100 | #116 | Exceptional 98.2% |
| Immigrants | France | 95.5 /100 | #117 | Exceptional 98.2% |
| Yugoslavians | 95.5 /100 | #118 | Exceptional 98.2% |
| Thais | 94.8 /100 | #119 | Exceptional 98.2% |
| Okinawans | 94.4 /100 | #120 | Exceptional 98.2% |
| Immigrants | Zimbabwe | 94.0 /100 | #121 | Exceptional 98.2% |
| Immigrants | Japan | 94.0 /100 | #122 | Exceptional 98.2% |
| Menominee | 93.9 /100 | #123 | Exceptional 98.2% |
| Syrians | 93.6 /100 | #124 | Exceptional 98.2% |
| Iroquois | 93.5 /100 | #125 | Exceptional 98.2% |
Demographics Similar to Slovenes by Kindergarten
In terms of kindergarten, the demographic groups most similar to Slovenes are Carpatho Rusyn (98.7%, a difference of 0.010%), English (98.7%, a difference of 0.010%), Swedish (98.7%, a difference of 0.020%), Tlingit-Haida (98.7%, a difference of 0.030%), and Slovak (98.7%, a difference of 0.030%).
| Demographics | Rating | Rank | Kindergarten |
| Tsimshian | 100.0 /100 | #5 | Exceptional 98.8% |
| Alaskan Athabascans | 100.0 /100 | #6 | Exceptional 98.8% |
| Alaska Natives | 100.0 /100 | #7 | Exceptional 98.7% |
| Norwegians | 100.0 /100 | #8 | Exceptional 98.7% |
| Tlingit-Haida | 100.0 /100 | #9 | Exceptional 98.7% |
| Slovaks | 100.0 /100 | #10 | Exceptional 98.7% |
| Germans | 100.0 /100 | #11 | Exceptional 98.7% |
| Slovenes | 100.0 /100 | #12 | Exceptional 98.7% |
| Carpatho Rusyns | 100.0 /100 | #13 | Exceptional 98.7% |
| English | 100.0 /100 | #14 | Exceptional 98.7% |
| Swedes | 100.0 /100 | #15 | Exceptional 98.7% |
| Aleuts | 100.0 /100 | #16 | Exceptional 98.6% |
| Scottish | 100.0 /100 | #17 | Exceptional 98.6% |
| Dutch | 100.0 /100 | #18 | Exceptional 98.6% |
| Irish | 100.0 /100 | #19 | Exceptional 98.6% |