Vietnamese vs Menominee 2nd Grade
COMPARE
Vietnamese
Menominee
2nd Grade
2nd Grade Comparison
Vietnamese
Menominee
96.7%
2ND GRADE
0.0/ 100
METRIC RATING
323rd/ 347
METRIC RANK
98.1%
2ND GRADE
94.1/ 100
METRIC RATING
124th/ 347
METRIC RANK
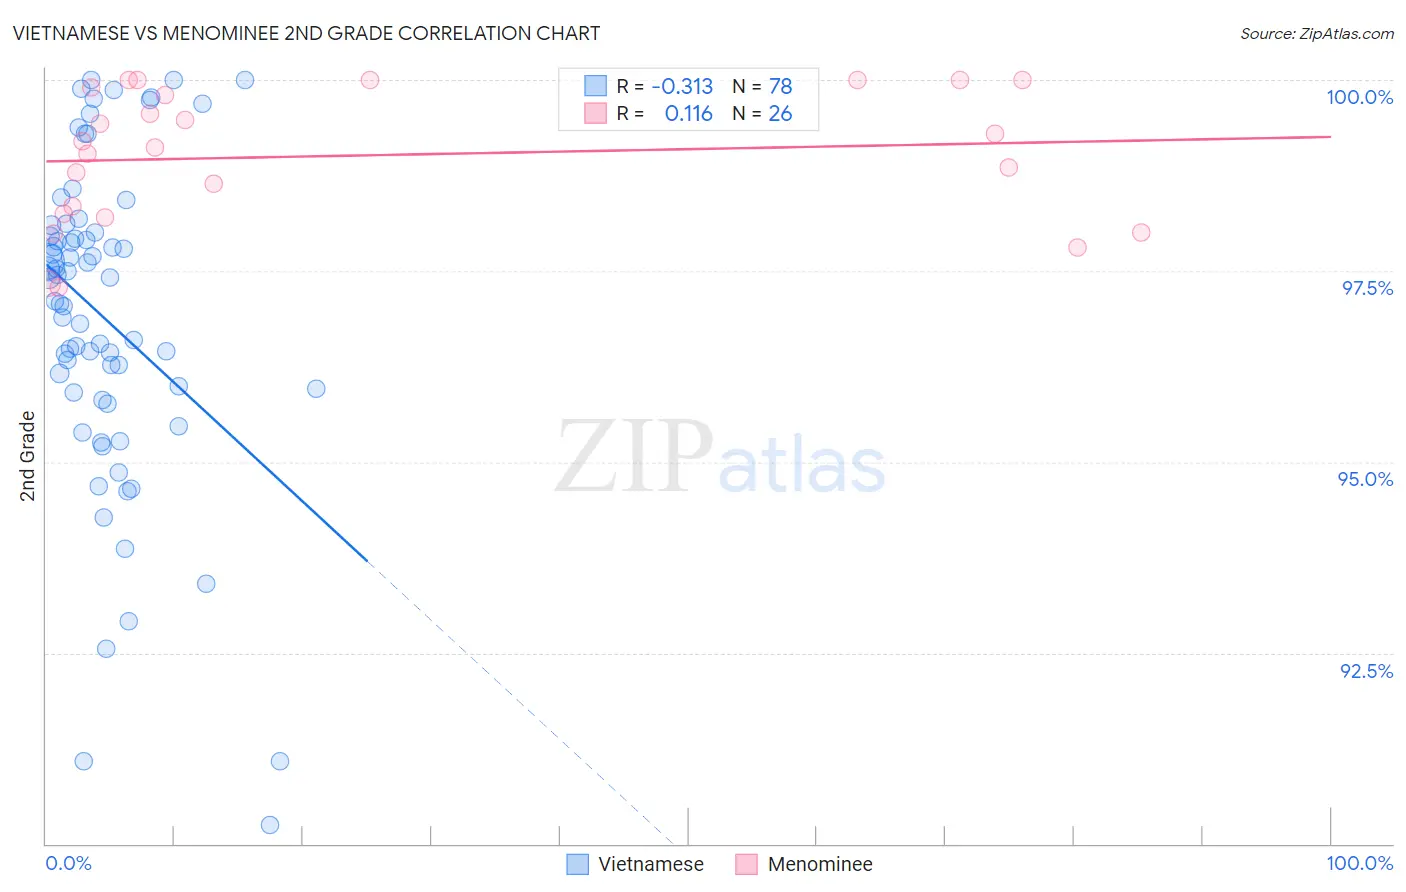
Vietnamese vs Menominee 2nd Grade Correlation Chart
The statistical analysis conducted on geographies consisting of 170,753,564 people shows a mild negative correlation between the proportion of Vietnamese and percentage of population with at least 2nd grade education in the United States with a correlation coefficient (R) of -0.313 and weighted average of 96.7%. Similarly, the statistical analysis conducted on geographies consisting of 45,778,979 people shows a poor positive correlation between the proportion of Menominee and percentage of population with at least 2nd grade education in the United States with a correlation coefficient (R) of 0.116 and weighted average of 98.1%, a difference of 1.5%.
2nd Grade Correlation Summary
| Measurement | Vietnamese | Menominee |
| Minimum | 90.2% | 97.3% |
| Maximum | 100.0% | 100.0% |
| Range | 9.8% | 2.7% |
| Mean | 96.9% | 99.0% |
| Median | 97.3% | 99.2% |
| Interquartile 25% (IQ1) | 95.9% | 98.3% |
| Interquartile 75% (IQ3) | 98.0% | 99.9% |
| Interquartile Range (IQR) | 2.1% | 1.6% |
| Standard Deviation (Sample) | 2.1% | 0.88% |
| Standard Deviation (Population) | 2.1% | 0.86% |
Similar Demographics by 2nd Grade
Demographics Similar to Vietnamese by 2nd Grade
In terms of 2nd grade, the demographic groups most similar to Vietnamese are Mexican American Indian (96.7%, a difference of 0.020%), Immigrants from Bangladesh (96.7%, a difference of 0.030%), Immigrants from Nicaragua (96.7%, a difference of 0.060%), Immigrants from Guyana (96.7%, a difference of 0.060%), and Immigrants from Burma/Myanmar (96.7%, a difference of 0.060%).
| Demographics | Rating | Rank | 2nd Grade |
| Hondurans | 0.0 /100 | #316 | Tragic 96.7% |
| Immigrants | Laos | 0.0 /100 | #317 | Tragic 96.7% |
| Indonesians | 0.0 /100 | #318 | Tragic 96.7% |
| Immigrants | Nicaragua | 0.0 /100 | #319 | Tragic 96.7% |
| Immigrants | Guyana | 0.0 /100 | #320 | Tragic 96.7% |
| Immigrants | Burma/Myanmar | 0.0 /100 | #321 | Tragic 96.7% |
| Immigrants | Bangladesh | 0.0 /100 | #322 | Tragic 96.7% |
| Vietnamese | 0.0 /100 | #323 | Tragic 96.7% |
| Mexican American Indians | 0.0 /100 | #324 | Tragic 96.7% |
| Dominicans | 0.0 /100 | #325 | Tragic 96.6% |
| Immigrants | Honduras | 0.0 /100 | #326 | Tragic 96.6% |
| Immigrants | Vietnam | 0.0 /100 | #327 | Tragic 96.5% |
| Mexicans | 0.0 /100 | #328 | Tragic 96.5% |
| Japanese | 0.0 /100 | #329 | Tragic 96.5% |
| Immigrants | Latin America | 0.0 /100 | #330 | Tragic 96.5% |
Demographics Similar to Menominee by 2nd Grade
In terms of 2nd grade, the demographic groups most similar to Menominee are Immigrants from Zimbabwe (98.1%, a difference of 0.0%), Lebanese (98.1%, a difference of 0.0%), Immigrants from Japan (98.1%, a difference of 0.0%), Iroquois (98.1%, a difference of 0.0%), and Syrian (98.1%, a difference of 0.0%).
| Demographics | Rating | Rank | 2nd Grade |
| Ute | 95.7 /100 | #117 | Exceptional 98.1% |
| Immigrants | France | 95.6 /100 | #118 | Exceptional 98.1% |
| Thais | 95.3 /100 | #119 | Exceptional 98.1% |
| Okinawans | 94.9 /100 | #120 | Exceptional 98.1% |
| Immigrants | Zimbabwe | 94.4 /100 | #121 | Exceptional 98.1% |
| Lebanese | 94.2 /100 | #122 | Exceptional 98.1% |
| Immigrants | Japan | 94.1 /100 | #123 | Exceptional 98.1% |
| Menominee | 94.1 /100 | #124 | Exceptional 98.1% |
| Iroquois | 94.1 /100 | #125 | Exceptional 98.1% |
| Syrians | 94.0 /100 | #126 | Exceptional 98.1% |
| Immigrants | Saudi Arabia | 93.6 /100 | #127 | Exceptional 98.1% |
| Immigrants | Serbia | 92.3 /100 | #128 | Exceptional 98.1% |
| Immigrants | Croatia | 92.1 /100 | #129 | Exceptional 98.1% |
| Seminole | 91.1 /100 | #130 | Exceptional 98.0% |
| Immigrants | Europe | 91.1 /100 | #131 | Exceptional 98.0% |