Venezuelan vs Armenian 12th Grade, No Diploma
COMPARE
Venezuelan
Armenian
12th Grade, No Diploma
12th Grade, No Diploma Comparison
Venezuelans
Armenians
91.7%
12TH GRADE, NO DIPLOMA
88.2/ 100
METRIC RATING
134th/ 347
METRIC RANK
90.6%
12TH GRADE, NO DIPLOMA
11.6/ 100
METRIC RATING
207th/ 347
METRIC RANK
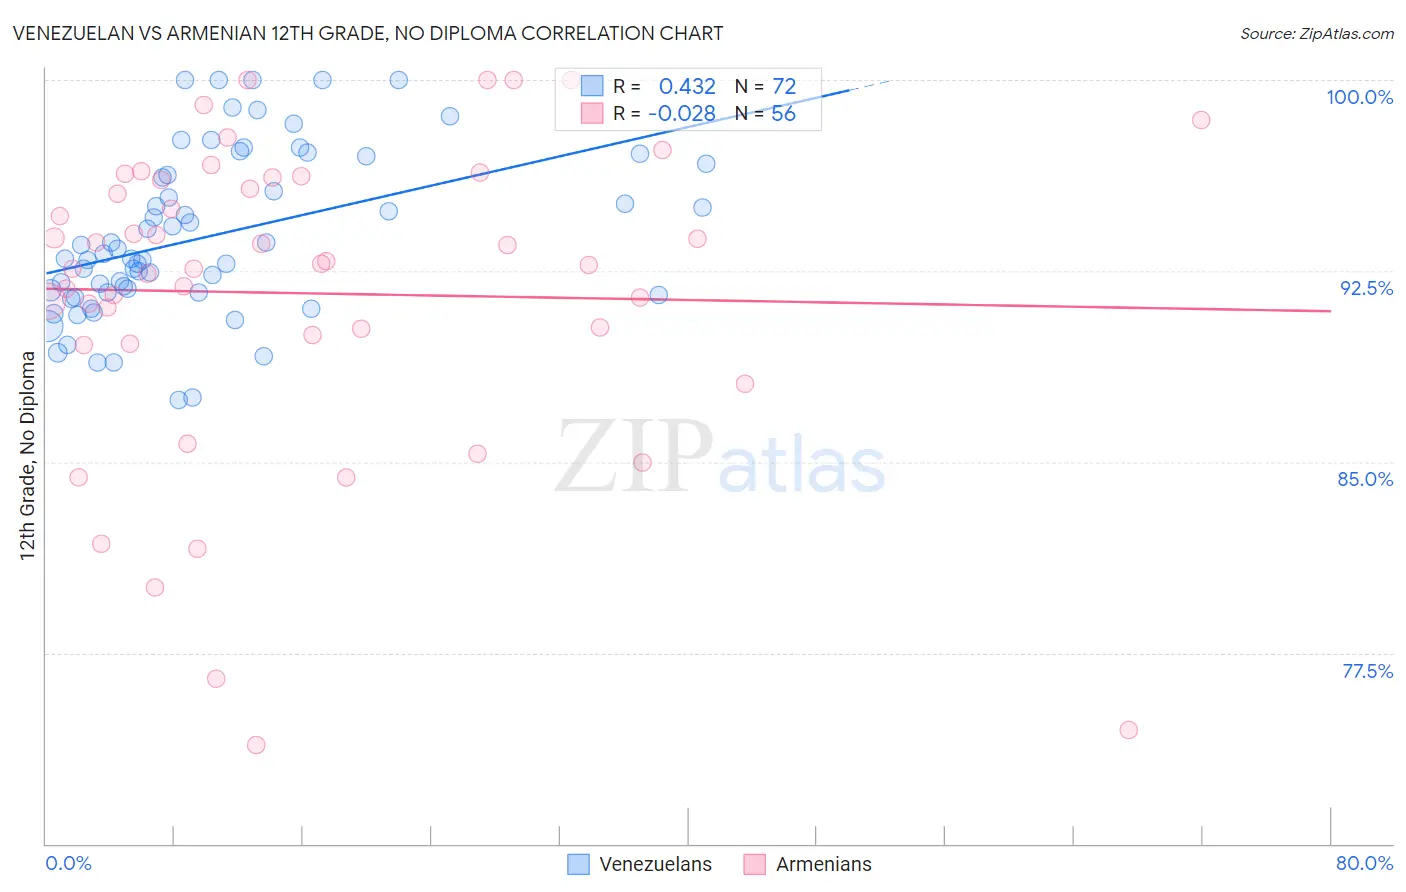
Venezuelan vs Armenian 12th Grade, No Diploma Correlation Chart
The statistical analysis conducted on geographies consisting of 306,323,887 people shows a moderate positive correlation between the proportion of Venezuelans and percentage of population with at least 12th grade (no diploma) education in the United States with a correlation coefficient (R) of 0.432 and weighted average of 91.7%. Similarly, the statistical analysis conducted on geographies consisting of 310,954,685 people shows no correlation between the proportion of Armenians and percentage of population with at least 12th grade (no diploma) education in the United States with a correlation coefficient (R) of -0.028 and weighted average of 90.6%, a difference of 1.3%.
12th Grade, No Diploma Correlation Summary
| Measurement | Venezuelan | Armenian |
| Minimum | 87.4% | 73.9% |
| Maximum | 100.0% | 100.0% |
| Range | 12.6% | 26.1% |
| Mean | 93.9% | 91.6% |
| Median | 93.1% | 92.7% |
| Interquartile 25% (IQ1) | 91.6% | 89.8% |
| Interquartile 75% (IQ3) | 96.5% | 96.1% |
| Interquartile Range (IQR) | 4.9% | 6.3% |
| Standard Deviation (Sample) | 3.2% | 6.2% |
| Standard Deviation (Population) | 3.2% | 6.1% |
Similar Demographics by 12th Grade, No Diploma
Demographics Similar to Venezuelans by 12th Grade, No Diploma
In terms of 12th grade, no diploma, the demographic groups most similar to Venezuelans are Immigrants from Italy (91.7%, a difference of 0.0%), Albanian (91.8%, a difference of 0.030%), Immigrants from Eastern Asia (91.8%, a difference of 0.030%), Immigrants from Bosnia and Herzegovina (91.7%, a difference of 0.030%), and Assyrian/Chaldean/Syriac (91.8%, a difference of 0.040%).
| Demographics | Rating | Rank | 12th Grade, No Diploma |
| Immigrants | Jordan | 91.0 /100 | #127 | Exceptional 91.8% |
| Mongolians | 89.9 /100 | #128 | Excellent 91.8% |
| German Russians | 89.8 /100 | #129 | Excellent 91.8% |
| Assyrians/Chaldeans/Syriacs | 89.6 /100 | #130 | Excellent 91.8% |
| Albanians | 89.3 /100 | #131 | Excellent 91.8% |
| Immigrants | Eastern Asia | 89.3 /100 | #132 | Excellent 91.8% |
| Immigrants | Italy | 88.3 /100 | #133 | Excellent 91.7% |
| Venezuelans | 88.2 /100 | #134 | Excellent 91.7% |
| Immigrants | Bosnia and Herzegovina | 87.3 /100 | #135 | Excellent 91.7% |
| Chileans | 85.8 /100 | #136 | Excellent 91.7% |
| Alaska Natives | 84.9 /100 | #137 | Excellent 91.6% |
| Arabs | 84.1 /100 | #138 | Excellent 91.6% |
| Immigrants | Egypt | 83.9 /100 | #139 | Excellent 91.6% |
| Immigrants | Poland | 82.3 /100 | #140 | Excellent 91.6% |
| Argentineans | 82.0 /100 | #141 | Excellent 91.6% |
Demographics Similar to Armenians by 12th Grade, No Diploma
In terms of 12th grade, no diploma, the demographic groups most similar to Armenians are Immigrants from Bolivia (90.6%, a difference of 0.020%), Immigrants from Micronesia (90.6%, a difference of 0.020%), Immigrants from Afghanistan (90.6%, a difference of 0.020%), South American Indian (90.6%, a difference of 0.020%), and Portuguese (90.6%, a difference of 0.030%).
| Demographics | Rating | Rank | 12th Grade, No Diploma |
| Liberians | 19.8 /100 | #200 | Poor 90.8% |
| Hawaiians | 19.7 /100 | #201 | Poor 90.8% |
| Marshallese | 18.2 /100 | #202 | Poor 90.7% |
| Tongans | 16.1 /100 | #203 | Poor 90.7% |
| French American Indians | 15.5 /100 | #204 | Poor 90.7% |
| Immigrants | Sierra Leone | 14.9 /100 | #205 | Poor 90.7% |
| Immigrants | Bolivia | 12.3 /100 | #206 | Poor 90.6% |
| Armenians | 11.6 /100 | #207 | Poor 90.6% |
| Immigrants | Micronesia | 11.0 /100 | #208 | Poor 90.6% |
| Immigrants | Afghanistan | 11.0 /100 | #209 | Poor 90.6% |
| South American Indians | 10.9 /100 | #210 | Poor 90.6% |
| Portuguese | 10.6 /100 | #211 | Poor 90.6% |
| Somalis | 10.2 /100 | #212 | Poor 90.6% |
| Costa Ricans | 9.4 /100 | #213 | Tragic 90.5% |
| Immigrants | Africa | 8.5 /100 | #214 | Tragic 90.5% |