U.S. Virgin Islander vs Immigrants from Eritrea High School Diploma
COMPARE
U.S. Virgin Islander
Immigrants from Eritrea
High School Diploma
High School Diploma Comparison
U.S. Virgin Islanders
Immigrants from Eritrea
87.1%
HIGH SCHOOL DIPLOMA
0.2/ 100
METRIC RATING
265th/ 347
METRIC RANK
87.8%
HIGH SCHOOL DIPLOMA
1.7/ 100
METRIC RATING
246th/ 347
METRIC RANK
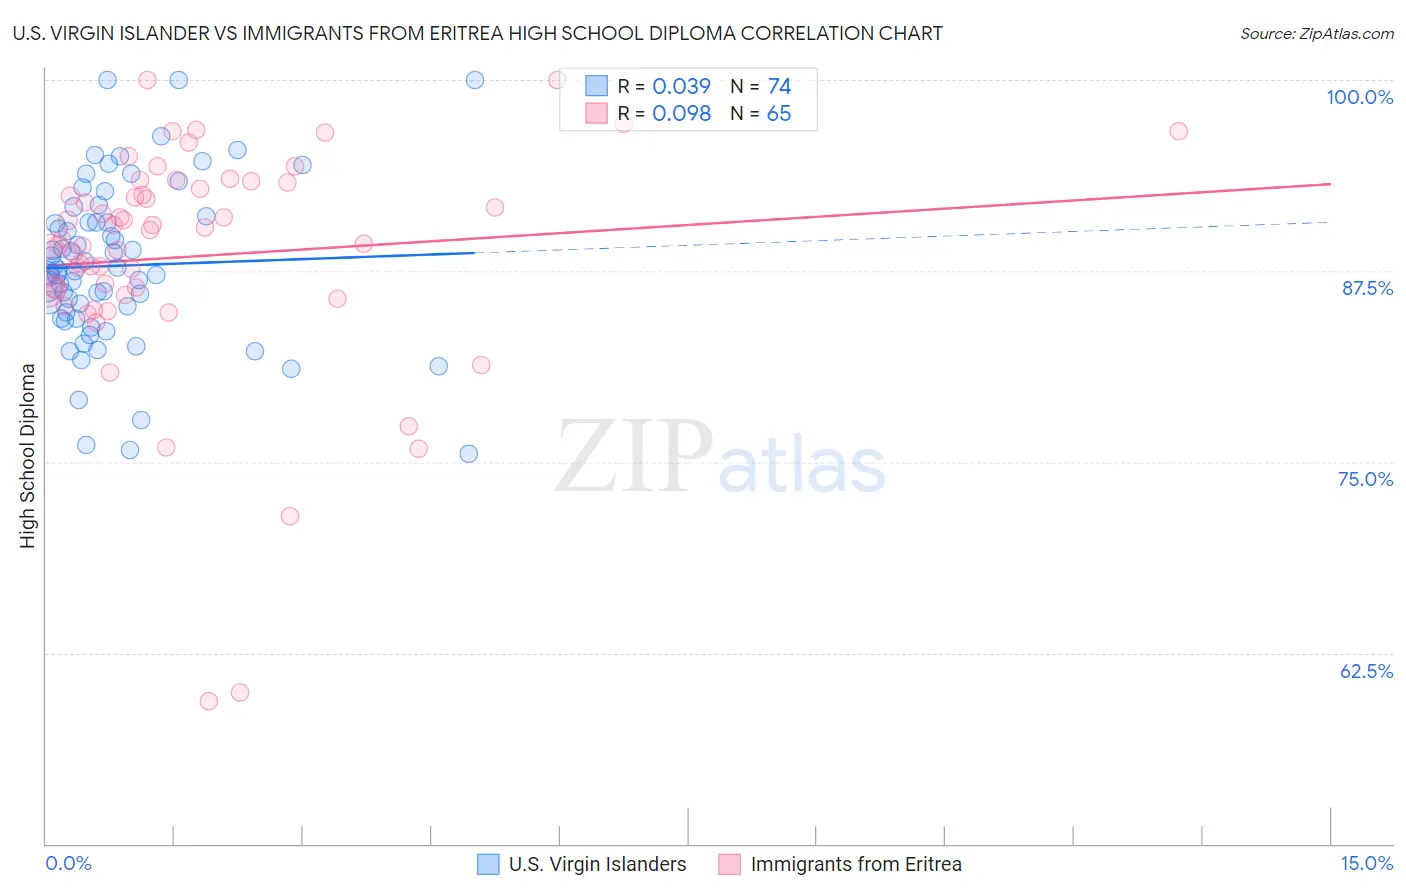
U.S. Virgin Islander vs Immigrants from Eritrea High School Diploma Correlation Chart
The statistical analysis conducted on geographies consisting of 87,451,137 people shows no correlation between the proportion of U.S. Virgin Islanders and percentage of population with at least high school diploma education in the United States with a correlation coefficient (R) of 0.039 and weighted average of 87.1%. Similarly, the statistical analysis conducted on geographies consisting of 104,792,854 people shows a slight positive correlation between the proportion of Immigrants from Eritrea and percentage of population with at least high school diploma education in the United States with a correlation coefficient (R) of 0.098 and weighted average of 87.8%, a difference of 0.80%.
High School Diploma Correlation Summary
| Measurement | U.S. Virgin Islander | Immigrants from Eritrea |
| Minimum | 75.5% | 59.3% |
| Maximum | 100.0% | 100.0% |
| Range | 24.5% | 40.7% |
| Mean | 87.8% | 88.5% |
| Median | 87.5% | 89.5% |
| Interquartile 25% (IQ1) | 84.4% | 86.1% |
| Interquartile 75% (IQ3) | 90.7% | 93.1% |
| Interquartile Range (IQR) | 6.3% | 7.0% |
| Standard Deviation (Sample) | 5.4% | 7.6% |
| Standard Deviation (Population) | 5.3% | 7.5% |
Demographics Similar to U.S. Virgin Islanders and Immigrants from Eritrea by High School Diploma
In terms of high school diploma, the demographic groups most similar to U.S. Virgin Islanders are Jamaican (87.2%, a difference of 0.13%), Immigrants from South Eastern Asia (87.2%, a difference of 0.16%), Immigrants from Peru (87.3%, a difference of 0.19%), Seminole (87.3%, a difference of 0.22%), and Cajun (87.3%, a difference of 0.24%). Similarly, the demographic groups most similar to Immigrants from Eritrea are Immigrants from Costa Rica (87.8%, a difference of 0.0%), Peruvian (87.8%, a difference of 0.030%), Spanish American (87.7%, a difference of 0.040%), Senegalese (87.7%, a difference of 0.050%), and Immigrants from Nigeria (87.7%, a difference of 0.050%).
| Demographics | Rating | Rank | High School Diploma |
| Peruvians | 1.9 /100 | #245 | Tragic 87.8% |
| Immigrants | Eritrea | 1.7 /100 | #246 | Tragic 87.8% |
| Immigrants | Costa Rica | 1.7 /100 | #247 | Tragic 87.8% |
| Spanish Americans | 1.5 /100 | #248 | Tragic 87.7% |
| Senegalese | 1.5 /100 | #249 | Tragic 87.7% |
| Immigrants | Nigeria | 1.5 /100 | #250 | Tragic 87.7% |
| Ghanaians | 1.4 /100 | #251 | Tragic 87.7% |
| Immigrants | South America | 1.2 /100 | #252 | Tragic 87.6% |
| Immigrants | Uruguay | 1.0 /100 | #253 | Tragic 87.6% |
| Immigrants | Colombia | 1.0 /100 | #254 | Tragic 87.6% |
| Immigrants | Senegal | 0.9 /100 | #255 | Tragic 87.6% |
| Africans | 0.7 /100 | #256 | Tragic 87.5% |
| Bahamians | 0.7 /100 | #257 | Tragic 87.5% |
| Immigrants | Ghana | 0.5 /100 | #258 | Tragic 87.4% |
| Immigrants | Western Africa | 0.5 /100 | #259 | Tragic 87.4% |
| Cajuns | 0.4 /100 | #260 | Tragic 87.3% |
| Seminole | 0.4 /100 | #261 | Tragic 87.3% |
| Immigrants | Peru | 0.4 /100 | #262 | Tragic 87.3% |
| Immigrants | South Eastern Asia | 0.3 /100 | #263 | Tragic 87.2% |
| Jamaicans | 0.3 /100 | #264 | Tragic 87.2% |
| U.S. Virgin Islanders | 0.2 /100 | #265 | Tragic 87.1% |