U.S. Virgin Islander vs Chippewa 7th Grade
COMPARE
U.S. Virgin Islander
Chippewa
7th Grade
7th Grade Comparison
U.S. Virgin Islanders
Chippewa
95.4%
7TH GRADE
1.6/ 100
METRIC RATING
243rd/ 347
METRIC RANK
97.3%
7TH GRADE
100.0/ 100
METRIC RATING
33rd/ 347
METRIC RANK
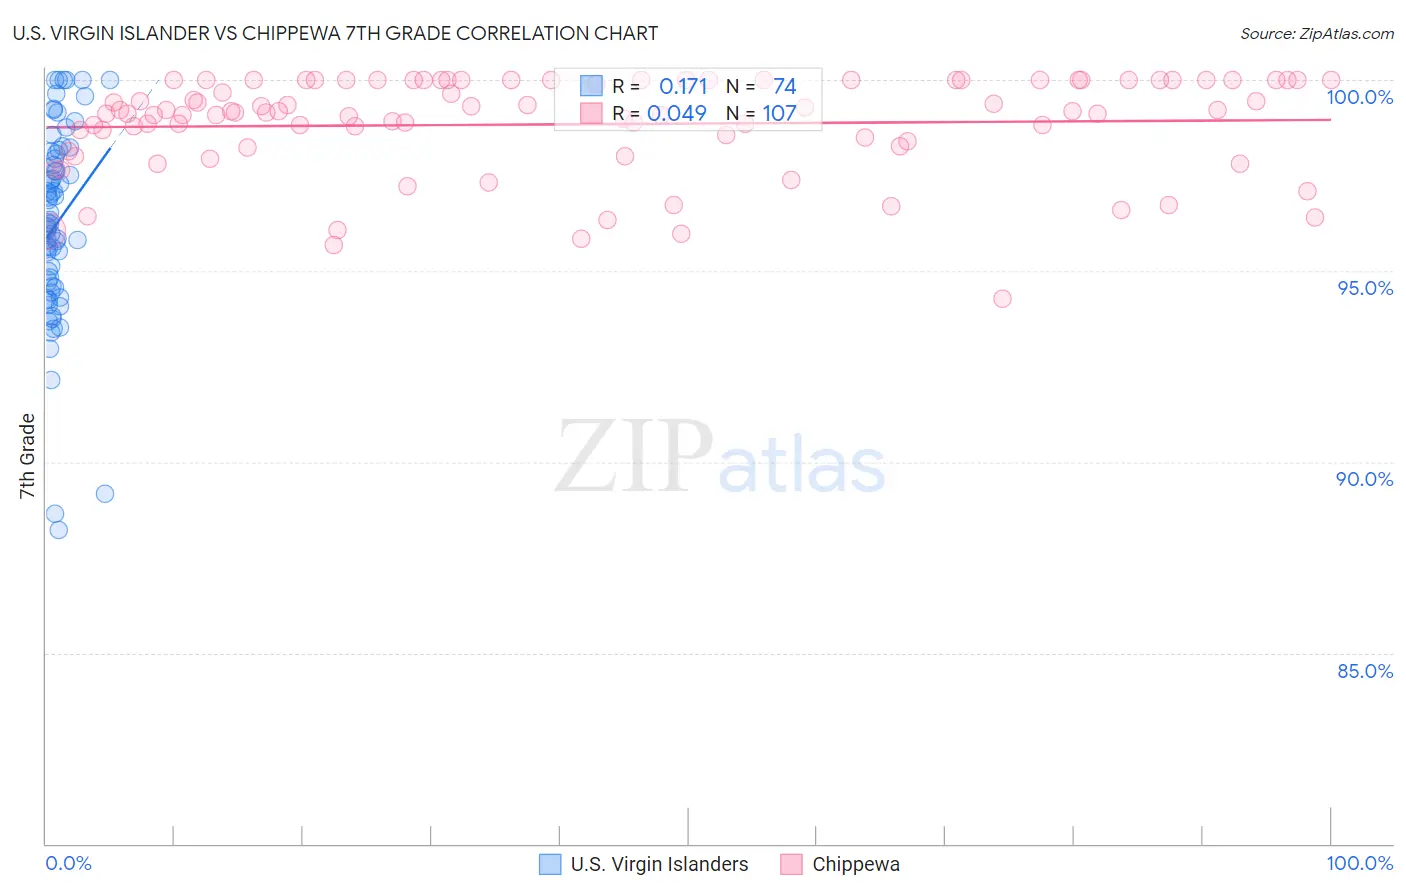
U.S. Virgin Islander vs Chippewa 7th Grade Correlation Chart
The statistical analysis conducted on geographies consisting of 87,529,315 people shows a poor positive correlation between the proportion of U.S. Virgin Islanders and percentage of population with at least 7th grade education in the United States with a correlation coefficient (R) of 0.171 and weighted average of 95.4%. Similarly, the statistical analysis conducted on geographies consisting of 215,065,863 people shows no correlation between the proportion of Chippewa and percentage of population with at least 7th grade education in the United States with a correlation coefficient (R) of 0.049 and weighted average of 97.3%, a difference of 2.0%.
7th Grade Correlation Summary
| Measurement | U.S. Virgin Islander | Chippewa |
| Minimum | 88.2% | 94.3% |
| Maximum | 100.0% | 100.0% |
| Range | 11.8% | 5.7% |
| Mean | 96.2% | 98.8% |
| Median | 96.2% | 99.1% |
| Interquartile 25% (IQ1) | 94.6% | 98.3% |
| Interquartile 75% (IQ3) | 98.1% | 100.0% |
| Interquartile Range (IQR) | 3.5% | 1.7% |
| Standard Deviation (Sample) | 2.5% | 1.3% |
| Standard Deviation (Population) | 2.5% | 1.3% |
Similar Demographics by 7th Grade
Demographics Similar to U.S. Virgin Islanders by 7th Grade
In terms of 7th grade, the demographic groups most similar to U.S. Virgin Islanders are Uruguayan (95.4%, a difference of 0.0%), Immigrants from Middle Africa (95.4%, a difference of 0.010%), Immigrants from Senegal (95.5%, a difference of 0.020%), Ethiopian (95.4%, a difference of 0.020%), and Immigrants from Sierra Leone (95.5%, a difference of 0.030%).
| Demographics | Rating | Rank | 7th Grade |
| Asians | 2.6 /100 | #236 | Tragic 95.5% |
| Immigrants | Asia | 2.3 /100 | #237 | Tragic 95.5% |
| Indians (Asian) | 2.3 /100 | #238 | Tragic 95.5% |
| Jamaicans | 2.2 /100 | #239 | Tragic 95.5% |
| Immigrants | Sierra Leone | 2.0 /100 | #240 | Tragic 95.5% |
| South American Indians | 2.0 /100 | #241 | Tragic 95.5% |
| Immigrants | Senegal | 1.9 /100 | #242 | Tragic 95.5% |
| U.S. Virgin Islanders | 1.6 /100 | #243 | Tragic 95.4% |
| Uruguayans | 1.6 /100 | #244 | Tragic 95.4% |
| Immigrants | Middle Africa | 1.5 /100 | #245 | Tragic 95.4% |
| Ethiopians | 1.5 /100 | #246 | Tragic 95.4% |
| Tongans | 1.3 /100 | #247 | Tragic 95.4% |
| Paiute | 1.2 /100 | #248 | Tragic 95.4% |
| Bolivians | 1.1 /100 | #249 | Tragic 95.4% |
| Immigrants | Cameroon | 0.9 /100 | #250 | Tragic 95.4% |
Demographics Similar to Chippewa by 7th Grade
In terms of 7th grade, the demographic groups most similar to Chippewa are European (97.3%, a difference of 0.010%), Italian (97.3%, a difference of 0.010%), Czech (97.4%, a difference of 0.030%), Alaska Native (97.3%, a difference of 0.030%), and Sioux (97.4%, a difference of 0.040%).
| Demographics | Rating | Rank | 7th Grade |
| Scotch-Irish | 100.0 /100 | #26 | Exceptional 97.4% |
| Danes | 100.0 /100 | #27 | Exceptional 97.4% |
| Sioux | 100.0 /100 | #28 | Exceptional 97.4% |
| Scandinavians | 100.0 /100 | #29 | Exceptional 97.4% |
| Czechs | 100.0 /100 | #30 | Exceptional 97.4% |
| Europeans | 100.0 /100 | #31 | Exceptional 97.3% |
| Italians | 100.0 /100 | #32 | Exceptional 97.3% |
| Chippewa | 100.0 /100 | #33 | Exceptional 97.3% |
| Alaska Natives | 100.0 /100 | #34 | Exceptional 97.3% |
| Swiss | 100.0 /100 | #35 | Exceptional 97.3% |
| Hungarians | 100.0 /100 | #36 | Exceptional 97.2% |
| British | 100.0 /100 | #37 | Exceptional 97.2% |
| Belgians | 100.0 /100 | #38 | Exceptional 97.2% |
| Latvians | 100.0 /100 | #39 | Exceptional 97.2% |
| Luxembourgers | 100.0 /100 | #40 | Exceptional 97.2% |