Ukrainian vs Immigrants from Micronesia 4th Grade
COMPARE
Ukrainian
Immigrants from Micronesia
4th Grade
4th Grade Comparison
Ukrainians
Immigrants from Micronesia
98.0%
4TH GRADE
99.2/ 100
METRIC RATING
79th/ 347
METRIC RANK
97.5%
4TH GRADE
49.6/ 100
METRIC RATING
175th/ 347
METRIC RANK
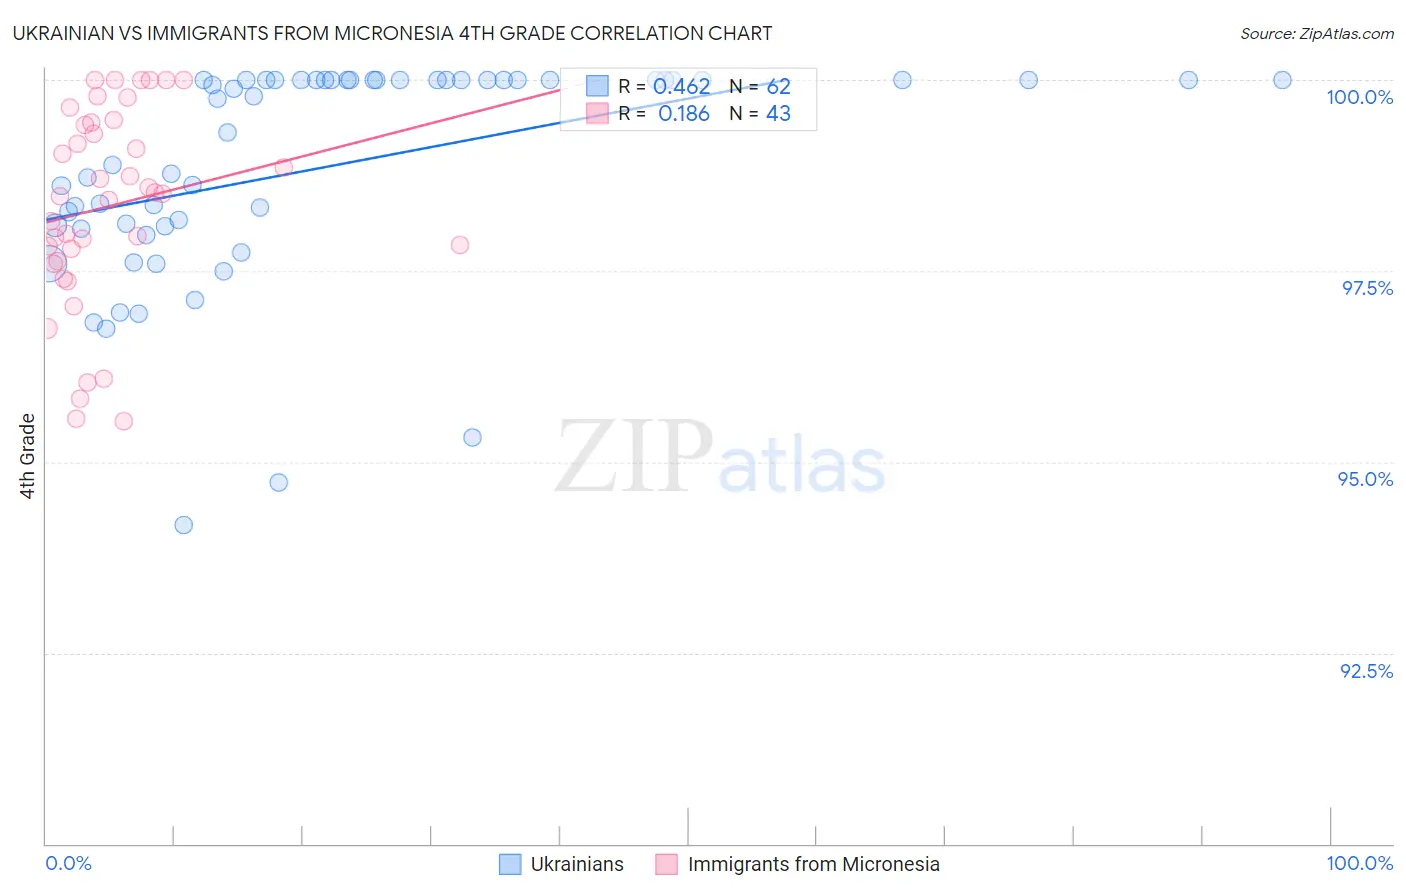
Ukrainian vs Immigrants from Micronesia 4th Grade Correlation Chart
The statistical analysis conducted on geographies consisting of 448,698,169 people shows a moderate positive correlation between the proportion of Ukrainians and percentage of population with at least 4th grade education in the United States with a correlation coefficient (R) of 0.462 and weighted average of 98.0%. Similarly, the statistical analysis conducted on geographies consisting of 61,604,657 people shows a poor positive correlation between the proportion of Immigrants from Micronesia and percentage of population with at least 4th grade education in the United States with a correlation coefficient (R) of 0.186 and weighted average of 97.5%, a difference of 0.46%.
4th Grade Correlation Summary
| Measurement | Ukrainian | Immigrants from Micronesia |
| Minimum | 94.2% | 95.5% |
| Maximum | 100.0% | 100.0% |
| Range | 5.8% | 4.5% |
| Mean | 98.9% | 98.4% |
| Median | 99.8% | 98.5% |
| Interquartile 25% (IQ1) | 98.1% | 97.6% |
| Interquartile 75% (IQ3) | 100.0% | 99.4% |
| Interquartile Range (IQR) | 1.9% | 1.8% |
| Standard Deviation (Sample) | 1.4% | 1.3% |
| Standard Deviation (Population) | 1.4% | 1.3% |
Similar Demographics by 4th Grade
Demographics Similar to Ukrainians by 4th Grade
In terms of 4th grade, the demographic groups most similar to Ukrainians are Osage (98.0%, a difference of 0.0%), Immigrants from Netherlands (98.0%, a difference of 0.010%), Cherokee (98.0%, a difference of 0.010%), Immigrants from Lithuania (98.0%, a difference of 0.010%), and Immigrants from England (98.0%, a difference of 0.010%).
| Demographics | Rating | Rank | 4th Grade |
| Iranians | 99.4 /100 | #72 | Exceptional 98.0% |
| Macedonians | 99.4 /100 | #73 | Exceptional 98.0% |
| Chickasaw | 99.4 /100 | #74 | Exceptional 98.0% |
| Immigrants | Netherlands | 99.3 /100 | #75 | Exceptional 98.0% |
| Cherokee | 99.3 /100 | #76 | Exceptional 98.0% |
| Immigrants | Lithuania | 99.3 /100 | #77 | Exceptional 98.0% |
| Immigrants | England | 99.3 /100 | #78 | Exceptional 98.0% |
| Ukrainians | 99.2 /100 | #79 | Exceptional 98.0% |
| Osage | 99.2 /100 | #80 | Exceptional 98.0% |
| Immigrants | India | 99.1 /100 | #81 | Exceptional 98.0% |
| Icelanders | 99.1 /100 | #82 | Exceptional 98.0% |
| Immigrants | Belgium | 99.0 /100 | #83 | Exceptional 97.9% |
| Cypriots | 98.9 /100 | #84 | Exceptional 97.9% |
| Potawatomi | 98.9 /100 | #85 | Exceptional 97.9% |
| Immigrants | Australia | 98.8 /100 | #86 | Exceptional 97.9% |
Demographics Similar to Immigrants from Micronesia by 4th Grade
In terms of 4th grade, the demographic groups most similar to Immigrants from Micronesia are Immigrants from Korea (97.5%, a difference of 0.0%), Egyptian (97.5%, a difference of 0.0%), Arab (97.5%, a difference of 0.0%), Immigrants from Spain (97.5%, a difference of 0.010%), and Brazilian (97.5%, a difference of 0.010%).
| Demographics | Rating | Rank | 4th Grade |
| Immigrants | Belarus | 55.8 /100 | #168 | Average 97.5% |
| Chileans | 54.4 /100 | #169 | Average 97.5% |
| Immigrants | Spain | 51.8 /100 | #170 | Average 97.5% |
| Brazilians | 51.5 /100 | #171 | Average 97.5% |
| Immigrants | Sri Lanka | 51.1 /100 | #172 | Average 97.5% |
| Immigrants | Korea | 50.6 /100 | #173 | Average 97.5% |
| Egyptians | 50.0 /100 | #174 | Average 97.5% |
| Immigrants | Micronesia | 49.6 /100 | #175 | Average 97.5% |
| Arabs | 48.7 /100 | #176 | Average 97.5% |
| Immigrants | Brazil | 46.1 /100 | #177 | Average 97.5% |
| Comanche | 45.3 /100 | #178 | Average 97.5% |
| Immigrants | Kazakhstan | 43.6 /100 | #179 | Average 97.5% |
| Immigrants | Venezuela | 42.7 /100 | #180 | Average 97.5% |
| Immigrants | Taiwan | 41.5 /100 | #181 | Average 97.5% |
| Spanish Americans | 39.3 /100 | #182 | Fair 97.5% |