Ugandan vs Maltese 4th Grade
COMPARE
Ugandan
Maltese
4th Grade
4th Grade Comparison
Ugandans
Maltese
97.6%
4TH GRADE
58.9/ 100
METRIC RATING
164th/ 347
METRIC RANK
98.1%
4TH GRADE
99.8/ 100
METRIC RATING
54th/ 347
METRIC RANK
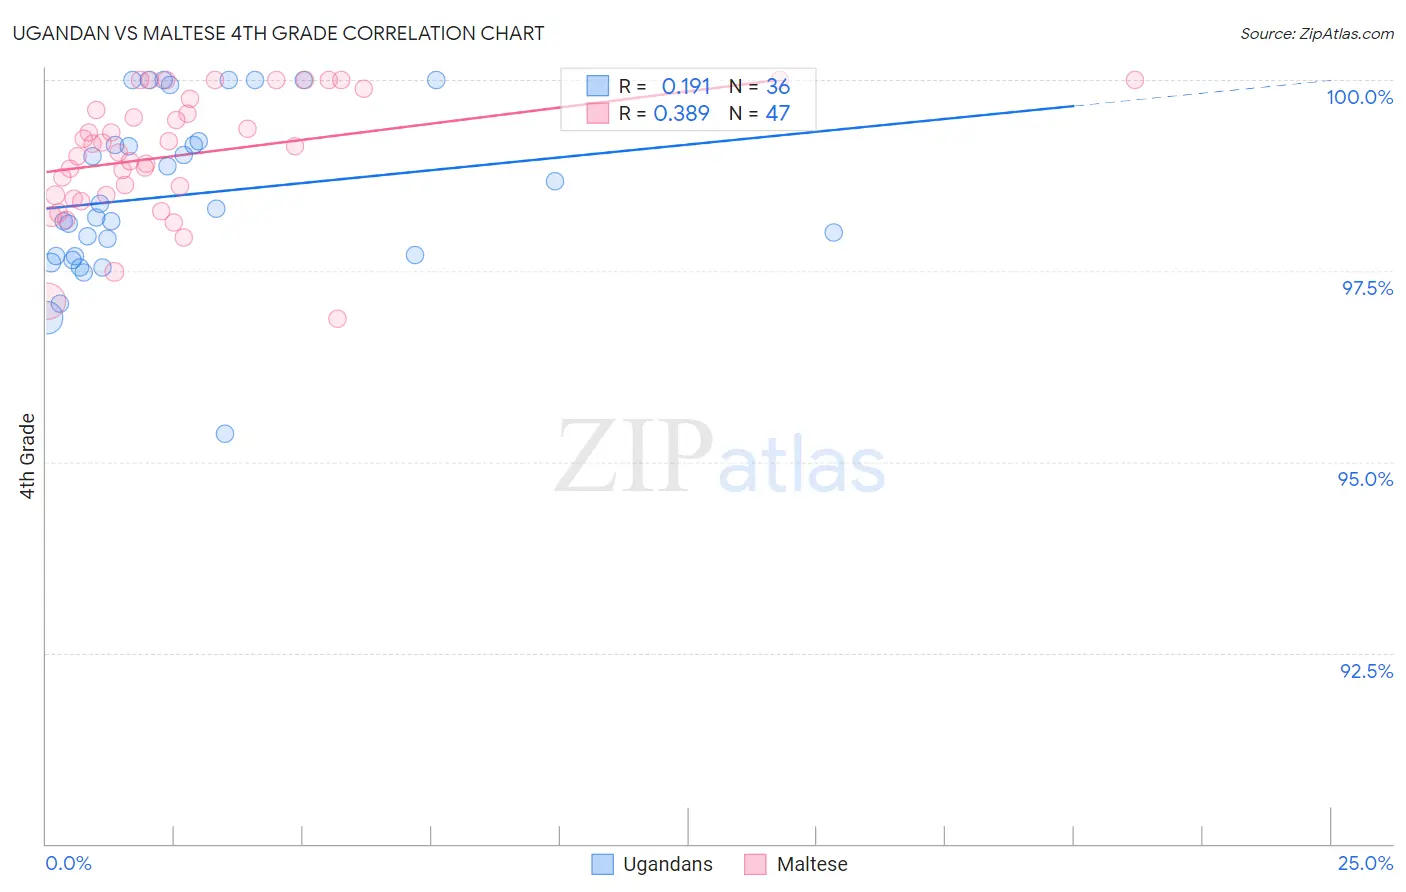
Ugandan vs Maltese 4th Grade Correlation Chart
The statistical analysis conducted on geographies consisting of 93,991,892 people shows a poor positive correlation between the proportion of Ugandans and percentage of population with at least 4th grade education in the United States with a correlation coefficient (R) of 0.191 and weighted average of 97.6%. Similarly, the statistical analysis conducted on geographies consisting of 126,476,608 people shows a mild positive correlation between the proportion of Maltese and percentage of population with at least 4th grade education in the United States with a correlation coefficient (R) of 0.389 and weighted average of 98.1%, a difference of 0.55%.
4th Grade Correlation Summary
| Measurement | Ugandan | Maltese |
| Minimum | 95.4% | 96.9% |
| Maximum | 100.0% | 100.0% |
| Range | 4.6% | 3.1% |
| Mean | 98.5% | 99.0% |
| Median | 98.3% | 99.1% |
| Interquartile 25% (IQ1) | 97.7% | 98.5% |
| Interquartile 75% (IQ3) | 99.2% | 99.8% |
| Interquartile Range (IQR) | 1.5% | 1.3% |
| Standard Deviation (Sample) | 1.1% | 0.80% |
| Standard Deviation (Population) | 1.1% | 0.79% |
Similar Demographics by 4th Grade
Demographics Similar to Ugandans by 4th Grade
In terms of 4th grade, the demographic groups most similar to Ugandans are Venezuelan (97.6%, a difference of 0.0%), Apache (97.6%, a difference of 0.010%), Marshallese (97.6%, a difference of 0.010%), Bermudan (97.6%, a difference of 0.010%), and Immigrants from Iran (97.6%, a difference of 0.010%).
| Demographics | Rating | Rank | 4th Grade |
| Immigrants | Bosnia and Herzegovina | 66.0 /100 | #157 | Good 97.6% |
| French American Indians | 65.9 /100 | #158 | Good 97.6% |
| Immigrants | Italy | 63.7 /100 | #159 | Good 97.6% |
| Apache | 61.3 /100 | #160 | Good 97.6% |
| Marshallese | 60.8 /100 | #161 | Good 97.6% |
| Bermudans | 60.5 /100 | #162 | Good 97.6% |
| Immigrants | Iran | 60.3 /100 | #163 | Good 97.6% |
| Ugandans | 58.9 /100 | #164 | Average 97.6% |
| Venezuelans | 58.7 /100 | #165 | Average 97.6% |
| Kenyans | 56.5 /100 | #166 | Average 97.5% |
| Immigrants | Poland | 55.9 /100 | #167 | Average 97.5% |
| Immigrants | Belarus | 55.8 /100 | #168 | Average 97.5% |
| Chileans | 54.4 /100 | #169 | Average 97.5% |
| Immigrants | Spain | 51.8 /100 | #170 | Average 97.5% |
| Brazilians | 51.5 /100 | #171 | Average 97.5% |
Demographics Similar to Maltese by 4th Grade
In terms of 4th grade, the demographic groups most similar to Maltese are Slavic (98.1%, a difference of 0.0%), White/Caucasian (98.1%, a difference of 0.0%), Greek (98.1%, a difference of 0.0%), Austrian (98.1%, a difference of 0.0%), and Immigrants from Scotland (98.1%, a difference of 0.010%).
| Demographics | Rating | Rank | 4th Grade |
| Arapaho | 99.9 /100 | #47 | Exceptional 98.1% |
| Estonians | 99.8 /100 | #48 | Exceptional 98.1% |
| Bulgarians | 99.8 /100 | #49 | Exceptional 98.1% |
| Immigrants | Scotland | 99.8 /100 | #50 | Exceptional 98.1% |
| Celtics | 99.8 /100 | #51 | Exceptional 98.1% |
| Australians | 99.8 /100 | #52 | Exceptional 98.1% |
| Slavs | 99.8 /100 | #53 | Exceptional 98.1% |
| Maltese | 99.8 /100 | #54 | Exceptional 98.1% |
| Whites/Caucasians | 99.8 /100 | #55 | Exceptional 98.1% |
| Greeks | 99.8 /100 | #56 | Exceptional 98.1% |
| Austrians | 99.8 /100 | #57 | Exceptional 98.1% |
| Creek | 99.8 /100 | #58 | Exceptional 98.1% |
| Americans | 99.8 /100 | #59 | Exceptional 98.1% |
| Immigrants | Canada | 99.7 /100 | #60 | Exceptional 98.1% |
| Immigrants | North America | 99.7 /100 | #61 | Exceptional 98.1% |