Trinidadian and Tobagonian vs Mexican High School Diploma
COMPARE
Trinidadian and Tobagonian
Mexican
High School Diploma
High School Diploma Comparison
Trinidadians and Tobagonians
Mexicans
86.9%
HIGH SCHOOL DIPLOMA
0.1/ 100
METRIC RATING
272nd/ 347
METRIC RANK
81.4%
HIGH SCHOOL DIPLOMA
0.0/ 100
METRIC RATING
341st/ 347
METRIC RANK
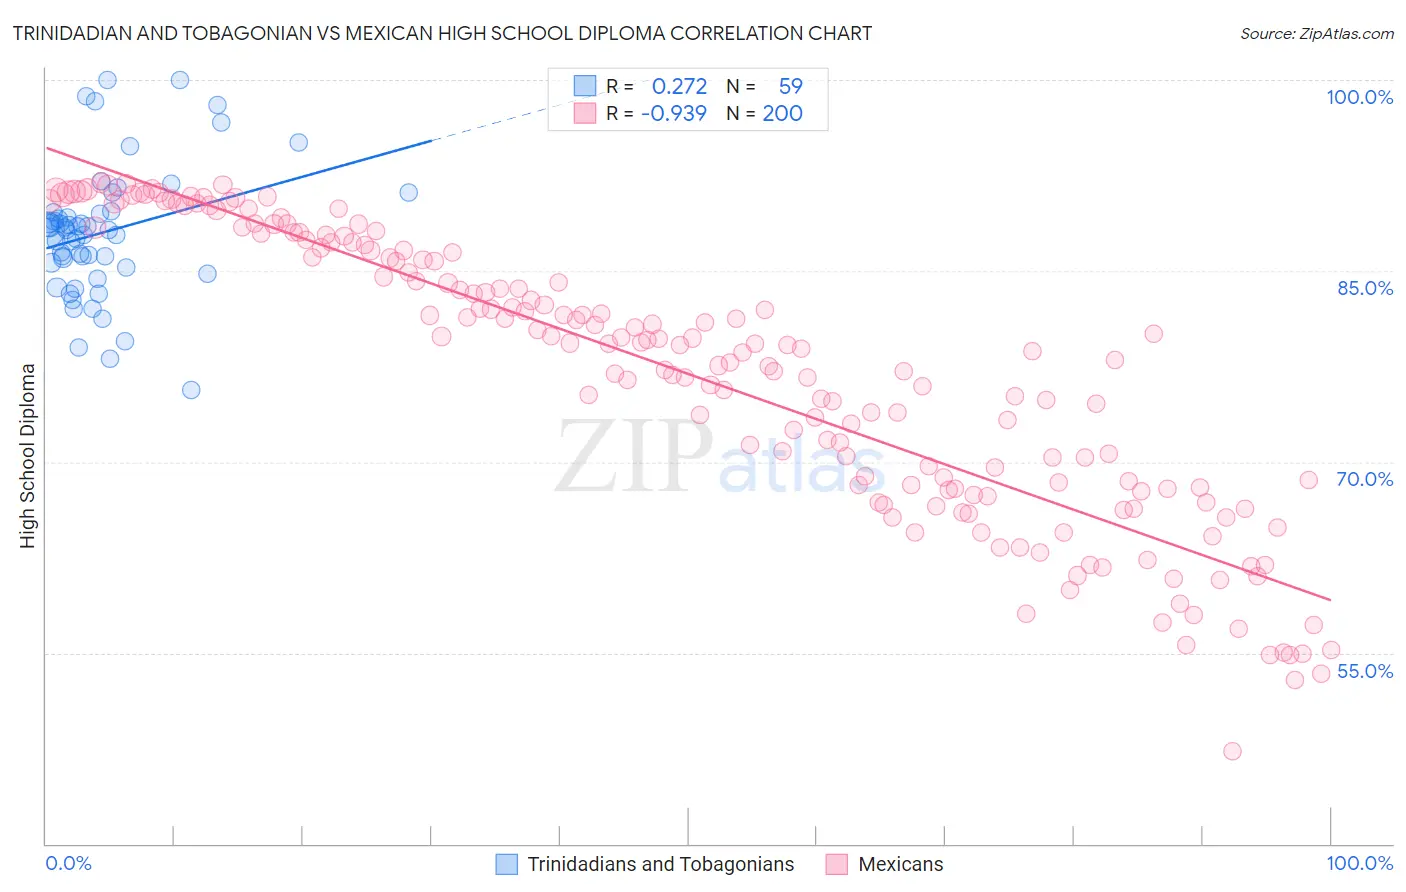
Trinidadian and Tobagonian vs Mexican High School Diploma Correlation Chart
The statistical analysis conducted on geographies consisting of 219,881,800 people shows a weak positive correlation between the proportion of Trinidadians and Tobagonians and percentage of population with at least high school diploma education in the United States with a correlation coefficient (R) of 0.272 and weighted average of 86.9%. Similarly, the statistical analysis conducted on geographies consisting of 565,337,755 people shows a near-perfect negative correlation between the proportion of Mexicans and percentage of population with at least high school diploma education in the United States with a correlation coefficient (R) of -0.939 and weighted average of 81.4%, a difference of 6.8%.
High School Diploma Correlation Summary
| Measurement | Trinidadian and Tobagonian | Mexican |
| Minimum | 75.6% | 47.2% |
| Maximum | 100.0% | 91.9% |
| Range | 24.4% | 44.7% |
| Mean | 88.0% | 76.9% |
| Median | 88.2% | 79.2% |
| Interquartile 25% (IQ1) | 85.3% | 68.0% |
| Interquartile 75% (IQ3) | 89.6% | 86.7% |
| Interquartile Range (IQR) | 4.3% | 18.7% |
| Standard Deviation (Sample) | 5.2% | 11.0% |
| Standard Deviation (Population) | 5.1% | 10.9% |
Similar Demographics by High School Diploma
Demographics Similar to Trinidadians and Tobagonians by High School Diploma
In terms of high school diploma, the demographic groups most similar to Trinidadians and Tobagonians are West Indian (86.9%, a difference of 0.010%), Immigrants from Jamaica (86.9%, a difference of 0.030%), Bangladeshi (86.9%, a difference of 0.040%), Malaysian (87.0%, a difference of 0.070%), and Sri Lankan (87.0%, a difference of 0.090%).
| Demographics | Rating | Rank | High School Diploma |
| U.S. Virgin Islanders | 0.2 /100 | #265 | Tragic 87.1% |
| Immigrants | Congo | 0.2 /100 | #266 | Tragic 87.0% |
| Blacks/African Americans | 0.2 /100 | #267 | Tragic 87.0% |
| Pennsylvania Germans | 0.2 /100 | #268 | Tragic 87.0% |
| Sri Lankans | 0.2 /100 | #269 | Tragic 87.0% |
| Malaysians | 0.2 /100 | #270 | Tragic 87.0% |
| West Indians | 0.1 /100 | #271 | Tragic 86.9% |
| Trinidadians and Tobagonians | 0.1 /100 | #272 | Tragic 86.9% |
| Immigrants | Jamaica | 0.1 /100 | #273 | Tragic 86.9% |
| Bangladeshis | 0.1 /100 | #274 | Tragic 86.9% |
| Immigrants | Trinidad and Tobago | 0.1 /100 | #275 | Tragic 86.8% |
| Immigrants | Burma/Myanmar | 0.1 /100 | #276 | Tragic 86.7% |
| Barbadians | 0.1 /100 | #277 | Tragic 86.7% |
| Hopi | 0.1 /100 | #278 | Tragic 86.6% |
| Immigrants | Laos | 0.0 /100 | #279 | Tragic 86.6% |
Demographics Similar to Mexicans by High School Diploma
In terms of high school diploma, the demographic groups most similar to Mexicans are Immigrants from Guatemala (81.4%, a difference of 0.040%), Houma (81.5%, a difference of 0.15%), Pima (81.6%, a difference of 0.26%), Salvadoran (81.7%, a difference of 0.36%), and Immigrants from Yemen (81.8%, a difference of 0.53%).
| Demographics | Rating | Rank | High School Diploma |
| Immigrants | Latin America | 0.0 /100 | #333 | Tragic 82.1% |
| Tohono O'odham | 0.0 /100 | #334 | Tragic 82.1% |
| Guatemalans | 0.0 /100 | #335 | Tragic 82.0% |
| Immigrants | Dominican Republic | 0.0 /100 | #336 | Tragic 82.0% |
| Immigrants | Yemen | 0.0 /100 | #337 | Tragic 81.8% |
| Salvadorans | 0.0 /100 | #338 | Tragic 81.7% |
| Pima | 0.0 /100 | #339 | Tragic 81.6% |
| Houma | 0.0 /100 | #340 | Tragic 81.5% |
| Mexicans | 0.0 /100 | #341 | Tragic 81.4% |
| Immigrants | Guatemala | 0.0 /100 | #342 | Tragic 81.4% |
| Immigrants | El Salvador | 0.0 /100 | #343 | Tragic 80.8% |
| Immigrants | Central America | 0.0 /100 | #344 | Tragic 80.1% |
| Yakama | 0.0 /100 | #345 | Tragic 80.0% |
| Spanish American Indians | 0.0 /100 | #346 | Tragic 79.8% |
| Immigrants | Mexico | 0.0 /100 | #347 | Tragic 79.5% |