Tongan vs Kiowa No Schooling Completed
COMPARE
Tongan
Kiowa
No Schooling Completed
No Schooling Completed Comparison
Tongans
Kiowa
2.3%
NO SCHOOLING COMPLETED
6.8/ 100
METRIC RATING
216th/ 347
METRIC RANK
1.6%
NO SCHOOLING COMPLETED
99.8/ 100
METRIC RATING
58th/ 347
METRIC RANK
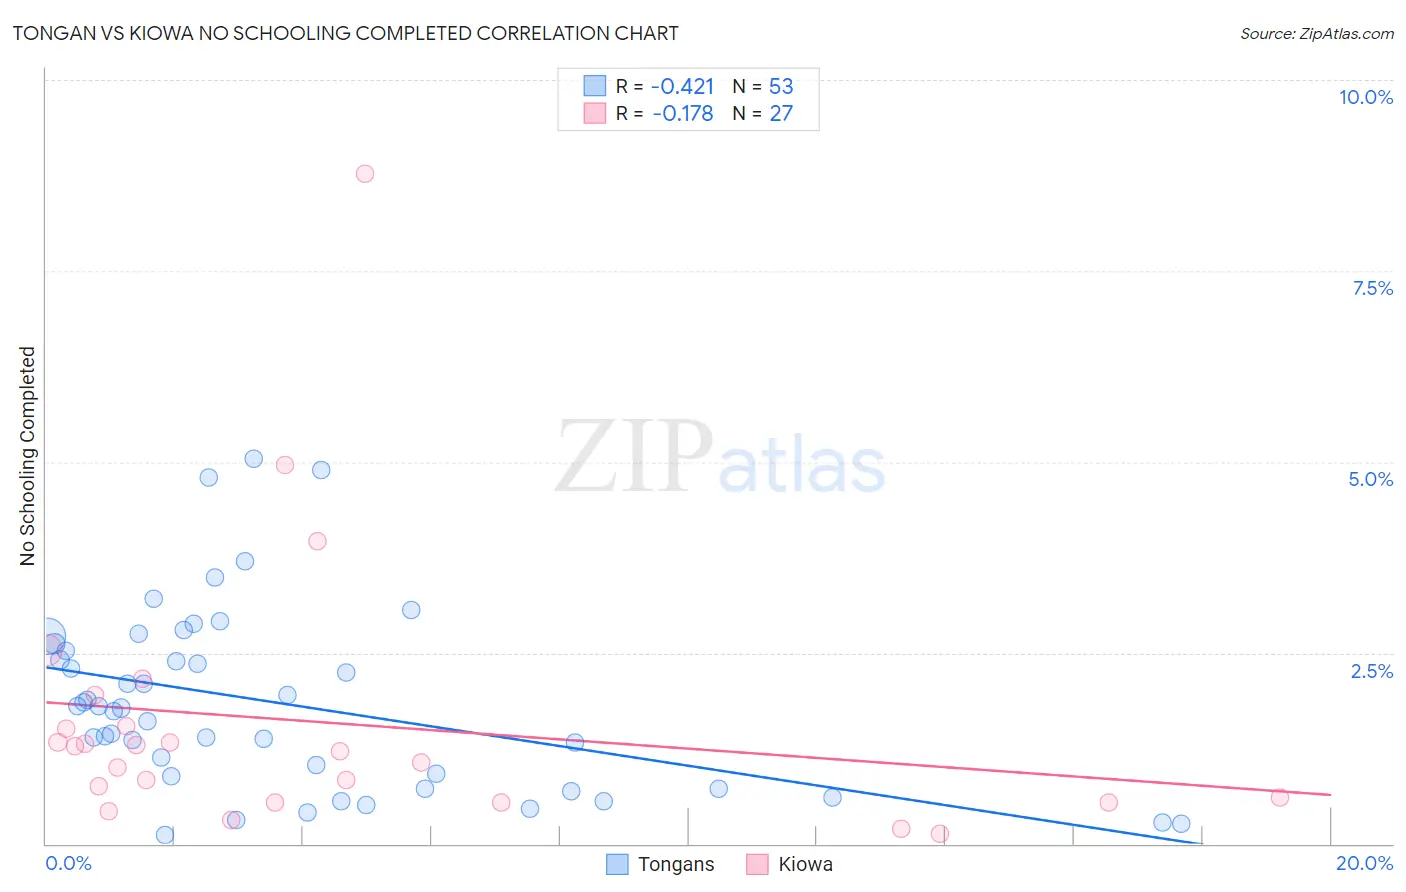
Tongan vs Kiowa No Schooling Completed Correlation Chart
The statistical analysis conducted on geographies consisting of 102,433,960 people shows a moderate negative correlation between the proportion of Tongans and percentage of population with no schooling in the United States with a correlation coefficient (R) of -0.421 and weighted average of 2.3%. Similarly, the statistical analysis conducted on geographies consisting of 55,891,433 people shows a poor negative correlation between the proportion of Kiowa and percentage of population with no schooling in the United States with a correlation coefficient (R) of -0.178 and weighted average of 1.6%, a difference of 38.0%.
No Schooling Completed Correlation Summary
| Measurement | Tongan | Kiowa |
| Minimum | 0.12% | 0.13% |
| Maximum | 5.0% | 8.8% |
| Range | 4.9% | 8.6% |
| Mean | 1.8% | 1.6% |
| Median | 1.8% | 1.2% |
| Interquartile 25% (IQ1) | 0.81% | 0.55% |
| Interquartile 75% (IQ3) | 2.6% | 1.5% |
| Interquartile Range (IQR) | 1.8% | 0.99% |
| Standard Deviation (Sample) | 1.2% | 1.8% |
| Standard Deviation (Population) | 1.2% | 1.8% |
Similar Demographics by No Schooling Completed
Demographics Similar to Tongans by No Schooling Completed
In terms of no schooling completed, the demographic groups most similar to Tongans are Immigrants from Syria (2.3%, a difference of 0.090%), Immigrants from Nepal (2.3%, a difference of 0.19%), Immigrants from Zaire (2.3%, a difference of 0.20%), Samoan (2.3%, a difference of 0.63%), and Senegalese (2.3%, a difference of 0.63%).
| Demographics | Rating | Rank | No Schooling Completed |
| Immigrants | Oceania | 10.2 /100 | #209 | Poor 2.2% |
| Natives/Alaskans | 10.0 /100 | #210 | Tragic 2.2% |
| Immigrants | Panama | 8.8 /100 | #211 | Tragic 2.3% |
| Immigrants | Morocco | 8.7 /100 | #212 | Tragic 2.3% |
| Ute | 8.2 /100 | #213 | Tragic 2.3% |
| Samoans | 8.2 /100 | #214 | Tragic 2.3% |
| Immigrants | Zaire | 7.2 /100 | #215 | Tragic 2.3% |
| Tongans | 6.8 /100 | #216 | Tragic 2.3% |
| Immigrants | Syria | 6.6 /100 | #217 | Tragic 2.3% |
| Immigrants | Nepal | 6.4 /100 | #218 | Tragic 2.3% |
| Senegalese | 5.6 /100 | #219 | Tragic 2.3% |
| Immigrants | Costa Rica | 5.1 /100 | #220 | Tragic 2.3% |
| Immigrants | Sudan | 5.0 /100 | #221 | Tragic 2.3% |
| Sub-Saharan Africans | 4.7 /100 | #222 | Tragic 2.3% |
| Immigrants | Lebanon | 4.5 /100 | #223 | Tragic 2.3% |
Demographics Similar to Kiowa by No Schooling Completed
In terms of no schooling completed, the demographic groups most similar to Kiowa are Slavic (1.7%, a difference of 0.070%), Austrian (1.6%, a difference of 0.16%), American (1.7%, a difference of 0.19%), Immigrants from North America (1.6%, a difference of 0.46%), and Greek (1.6%, a difference of 0.47%).
| Demographics | Rating | Rank | No Schooling Completed |
| Chippewa | 99.8 /100 | #51 | Exceptional 1.6% |
| Immigrants | Canada | 99.8 /100 | #52 | Exceptional 1.6% |
| Creek | 99.8 /100 | #53 | Exceptional 1.6% |
| Crow | 99.8 /100 | #54 | Exceptional 1.6% |
| Greeks | 99.8 /100 | #55 | Exceptional 1.6% |
| Immigrants | North America | 99.8 /100 | #56 | Exceptional 1.6% |
| Austrians | 99.8 /100 | #57 | Exceptional 1.6% |
| Kiowa | 99.8 /100 | #58 | Exceptional 1.6% |
| Slavs | 99.8 /100 | #59 | Exceptional 1.7% |
| Americans | 99.8 /100 | #60 | Exceptional 1.7% |
| Tsimshian | 99.8 /100 | #61 | Exceptional 1.7% |
| Immigrants | Northern Europe | 99.8 /100 | #62 | Exceptional 1.7% |
| Russians | 99.8 /100 | #63 | Exceptional 1.7% |
| New Zealanders | 99.7 /100 | #64 | Exceptional 1.7% |
| Serbians | 99.7 /100 | #65 | Exceptional 1.7% |