Tongan vs Immigrants from Central America 1st Grade
COMPARE
Tongan
Immigrants from Central America
1st Grade
1st Grade Comparison
Tongans
Immigrants from Central America
97.7%
1ST GRADE
4.6/ 100
METRIC RATING
220th/ 347
METRIC RANK
96.3%
1ST GRADE
0.0/ 100
METRIC RATING
341st/ 347
METRIC RANK
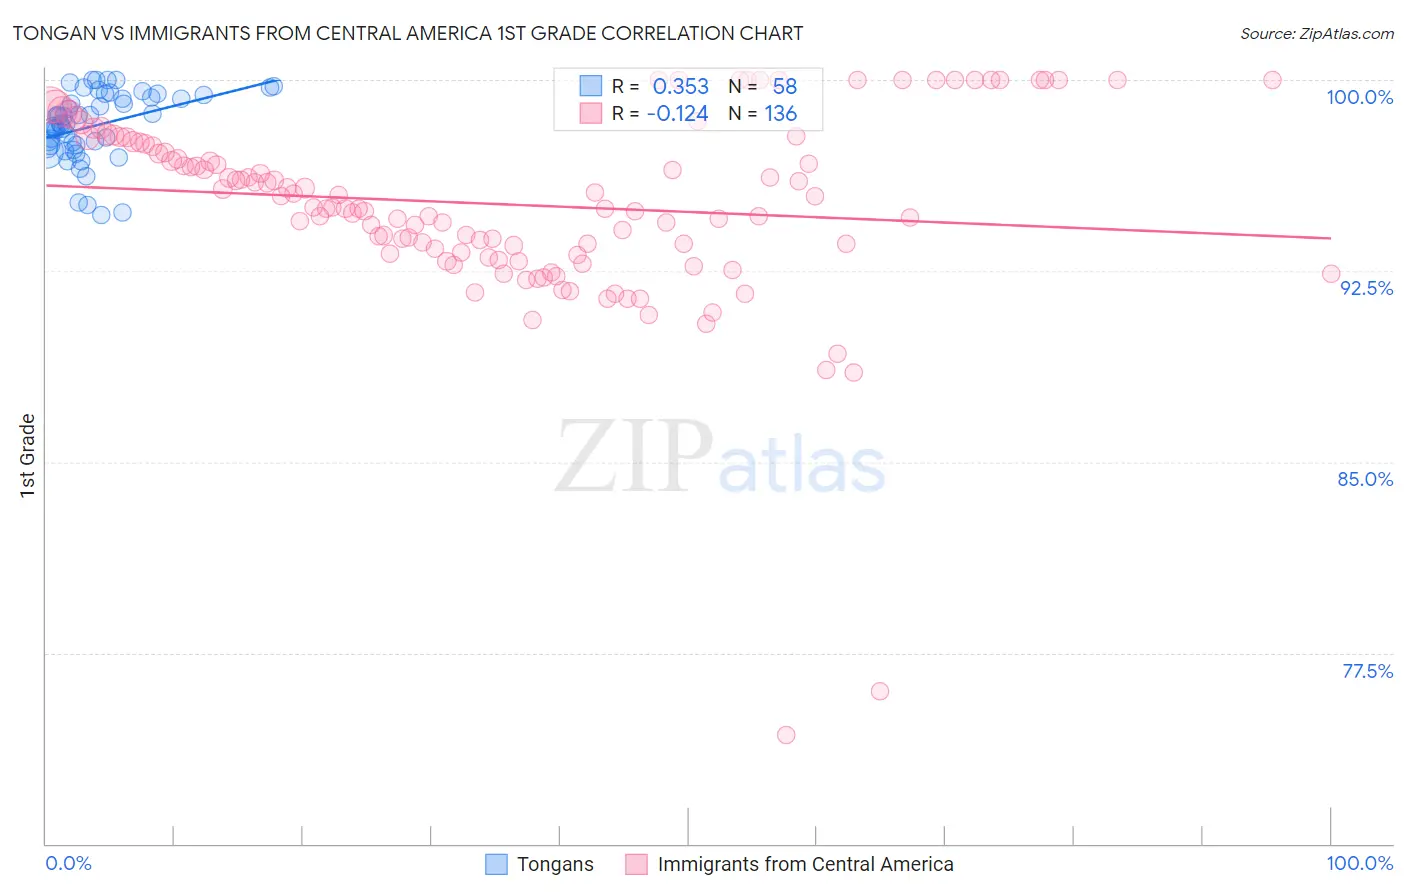
Tongan vs Immigrants from Central America 1st Grade Correlation Chart
The statistical analysis conducted on geographies consisting of 102,908,759 people shows a mild positive correlation between the proportion of Tongans and percentage of population with at least 1st grade education in the United States with a correlation coefficient (R) of 0.353 and weighted average of 97.7%. Similarly, the statistical analysis conducted on geographies consisting of 536,554,221 people shows a poor negative correlation between the proportion of Immigrants from Central America and percentage of population with at least 1st grade education in the United States with a correlation coefficient (R) of -0.124 and weighted average of 96.3%, a difference of 1.4%.
1st Grade Correlation Summary
| Measurement | Tongan | Immigrants from Central America |
| Minimum | 94.7% | 74.3% |
| Maximum | 100.0% | 100.0% |
| Range | 5.3% | 25.7% |
| Mean | 98.2% | 95.1% |
| Median | 98.3% | 95.0% |
| Interquartile 25% (IQ1) | 97.4% | 93.2% |
| Interquartile 75% (IQ3) | 99.3% | 97.6% |
| Interquartile Range (IQR) | 1.9% | 4.4% |
| Standard Deviation (Sample) | 1.3% | 3.7% |
| Standard Deviation (Population) | 1.3% | 3.7% |
Similar Demographics by 1st Grade
Demographics Similar to Tongans by 1st Grade
In terms of 1st grade, the demographic groups most similar to Tongans are Immigrants from Morocco (97.7%, a difference of 0.010%), Immigrants from Panama (97.7%, a difference of 0.010%), Immigrants from Sudan (97.7%, a difference of 0.010%), Immigrants from Syria (97.7%, a difference of 0.010%), and Immigrants from Zaire (97.7%, a difference of 0.010%).
| Demographics | Rating | Rank | 1st Grade |
| Immigrants | Bahamas | 8.1 /100 | #213 | Tragic 97.7% |
| South American Indians | 7.6 /100 | #214 | Tragic 97.7% |
| Bahamians | 7.5 /100 | #215 | Tragic 97.7% |
| Uruguayans | 7.4 /100 | #216 | Tragic 97.7% |
| Samoans | 6.8 /100 | #217 | Tragic 97.7% |
| Immigrants | Morocco | 5.3 /100 | #218 | Tragic 97.7% |
| Immigrants | Panama | 5.2 /100 | #219 | Tragic 97.7% |
| Tongans | 4.6 /100 | #220 | Tragic 97.7% |
| Immigrants | Sudan | 4.3 /100 | #221 | Tragic 97.7% |
| Immigrants | Syria | 4.2 /100 | #222 | Tragic 97.7% |
| Immigrants | Zaire | 4.1 /100 | #223 | Tragic 97.7% |
| Iraqis | 4.0 /100 | #224 | Tragic 97.7% |
| Immigrants | Nepal | 4.0 /100 | #225 | Tragic 97.7% |
| Sudanese | 3.7 /100 | #226 | Tragic 97.7% |
| Sierra Leoneans | 3.6 /100 | #227 | Tragic 97.7% |
Demographics Similar to Immigrants from Central America by 1st Grade
In terms of 1st grade, the demographic groups most similar to Immigrants from Central America are Immigrants from Cabo Verde (96.3%, a difference of 0.020%), Immigrants from Mexico (96.3%, a difference of 0.030%), Immigrants from Guatemala (96.4%, a difference of 0.040%), Salvadoran (96.3%, a difference of 0.060%), and Immigrants from Fiji (96.4%, a difference of 0.11%).
| Demographics | Rating | Rank | 1st Grade |
| Immigrants | Dominican Republic | 0.0 /100 | #333 | Tragic 96.5% |
| Bangladeshis | 0.0 /100 | #334 | Tragic 96.5% |
| Yakama | 0.0 /100 | #335 | Tragic 96.5% |
| Guatemalans | 0.0 /100 | #336 | Tragic 96.5% |
| Immigrants | Cambodia | 0.0 /100 | #337 | Tragic 96.5% |
| Immigrants | Fiji | 0.0 /100 | #338 | Tragic 96.4% |
| Immigrants | Guatemala | 0.0 /100 | #339 | Tragic 96.4% |
| Immigrants | Cabo Verde | 0.0 /100 | #340 | Tragic 96.3% |
| Immigrants | Central America | 0.0 /100 | #341 | Tragic 96.3% |
| Immigrants | Mexico | 0.0 /100 | #342 | Tragic 96.3% |
| Salvadorans | 0.0 /100 | #343 | Tragic 96.3% |
| Nepalese | 0.0 /100 | #344 | Tragic 96.1% |
| Immigrants | El Salvador | 0.0 /100 | #345 | Tragic 96.1% |
| Immigrants | Yemen | 0.0 /100 | #346 | Tragic 95.8% |
| Spanish American Indians | 0.0 /100 | #347 | Tragic 95.7% |