Tongan vs Cheyenne 5th Grade
COMPARE
Tongan
Cheyenne
5th Grade
5th Grade Comparison
Tongans
Cheyenne
97.0%
5TH GRADE
5.3/ 100
METRIC RATING
226th/ 347
METRIC RANK
97.7%
5TH GRADE
97.9/ 100
METRIC RATING
103rd/ 347
METRIC RANK
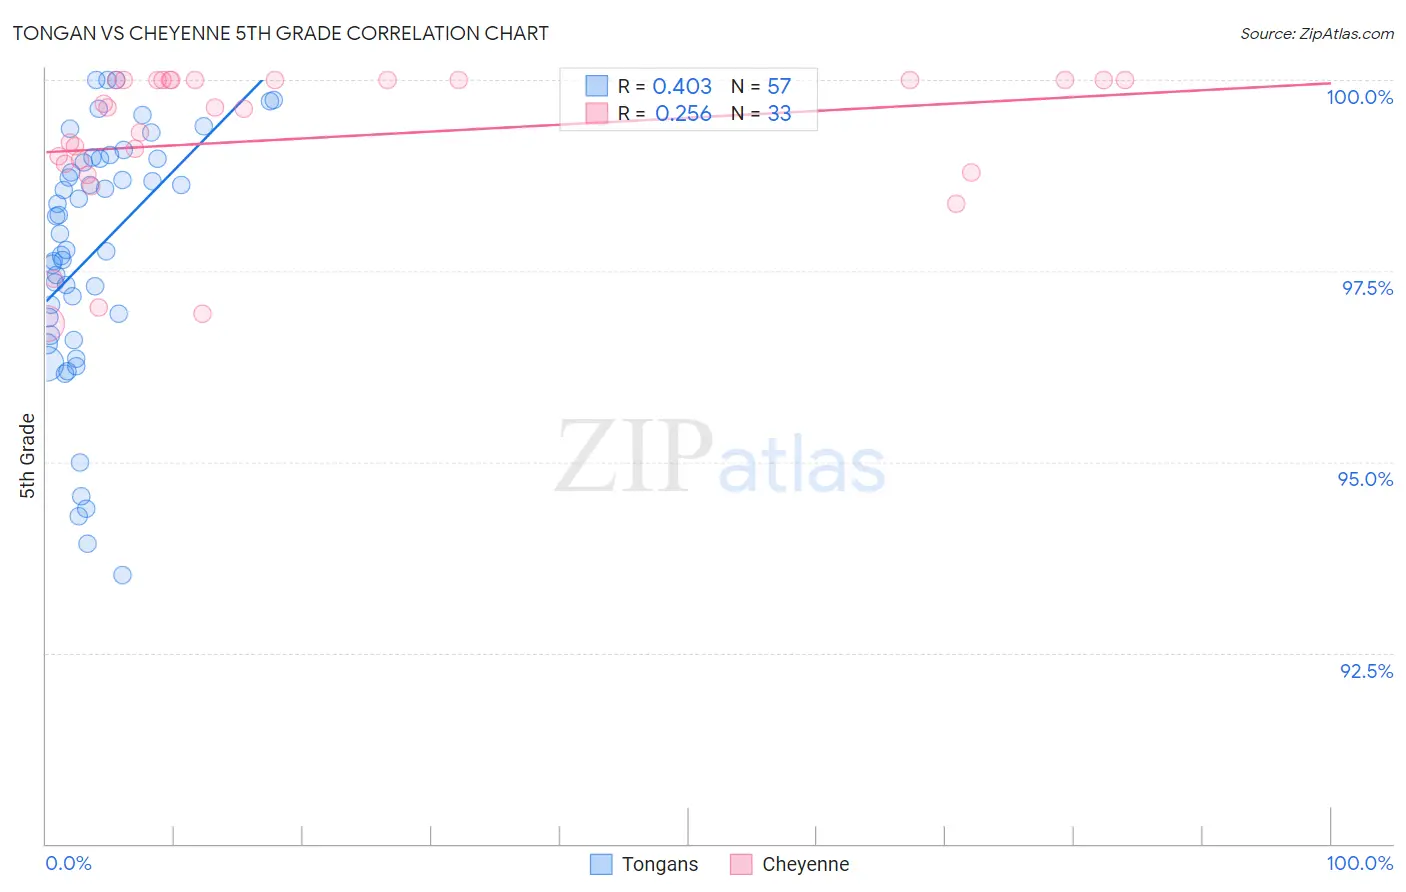
Tongan vs Cheyenne 5th Grade Correlation Chart
The statistical analysis conducted on geographies consisting of 102,877,776 people shows a moderate positive correlation between the proportion of Tongans and percentage of population with at least 5th grade education in the United States with a correlation coefficient (R) of 0.403 and weighted average of 97.0%. Similarly, the statistical analysis conducted on geographies consisting of 80,716,760 people shows a weak positive correlation between the proportion of Cheyenne and percentage of population with at least 5th grade education in the United States with a correlation coefficient (R) of 0.256 and weighted average of 97.7%, a difference of 0.70%.
5th Grade Correlation Summary
| Measurement | Tongan | Cheyenne |
| Minimum | 93.5% | 96.8% |
| Maximum | 100.0% | 100.0% |
| Range | 6.5% | 3.2% |
| Mean | 97.7% | 99.2% |
| Median | 98.0% | 99.6% |
| Interquartile 25% (IQ1) | 96.8% | 98.8% |
| Interquartile 75% (IQ3) | 99.0% | 100.0% |
| Interquartile Range (IQR) | 2.2% | 1.2% |
| Standard Deviation (Sample) | 1.6% | 0.97% |
| Standard Deviation (Population) | 1.6% | 0.95% |
Similar Demographics by 5th Grade
Demographics Similar to Tongans by 5th Grade
In terms of 5th grade, the demographic groups most similar to Tongans are South American Indian (97.0%, a difference of 0.0%), Bahamian (97.0%, a difference of 0.0%), Sierra Leonean (97.1%, a difference of 0.010%), Immigrants from Panama (97.0%, a difference of 0.010%), and Liberian (97.0%, a difference of 0.010%).
| Demographics | Rating | Rank | 5th Grade |
| Immigrants | Syria | 6.4 /100 | #219 | Tragic 97.1% |
| Immigrants | Southern Europe | 6.3 /100 | #220 | Tragic 97.1% |
| Sierra Leoneans | 6.0 /100 | #221 | Tragic 97.1% |
| Immigrants | Panama | 5.7 /100 | #222 | Tragic 97.0% |
| Liberians | 5.7 /100 | #223 | Tragic 97.0% |
| South American Indians | 5.4 /100 | #224 | Tragic 97.0% |
| Bahamians | 5.3 /100 | #225 | Tragic 97.0% |
| Tongans | 5.3 /100 | #226 | Tragic 97.0% |
| Immigrants | Pakistan | 4.7 /100 | #227 | Tragic 97.0% |
| Assyrians/Chaldeans/Syriacs | 4.5 /100 | #228 | Tragic 97.0% |
| Yuman | 4.5 /100 | #229 | Tragic 97.0% |
| Immigrants | Western Asia | 4.3 /100 | #230 | Tragic 97.0% |
| Immigrants | Malaysia | 4.1 /100 | #231 | Tragic 97.0% |
| Immigrants | Eastern Asia | 4.0 /100 | #232 | Tragic 97.0% |
| Sub-Saharan Africans | 3.3 /100 | #233 | Tragic 97.0% |
Demographics Similar to Cheyenne by 5th Grade
In terms of 5th grade, the demographic groups most similar to Cheyenne are Choctaw (97.7%, a difference of 0.0%), German Russian (97.7%, a difference of 0.010%), Yugoslavian (97.7%, a difference of 0.020%), Turkish (97.7%, a difference of 0.020%), and Puget Sound Salish (97.7%, a difference of 0.020%).
| Demographics | Rating | Rank | 5th Grade |
| Immigrants | Germany | 98.5 /100 | #96 | Exceptional 97.8% |
| Cree | 98.4 /100 | #97 | Exceptional 97.7% |
| Yugoslavians | 98.3 /100 | #98 | Exceptional 97.7% |
| Turks | 98.3 /100 | #99 | Exceptional 97.7% |
| Puget Sound Salish | 98.3 /100 | #100 | Exceptional 97.7% |
| South Africans | 98.3 /100 | #101 | Exceptional 97.7% |
| Choctaw | 98.0 /100 | #102 | Exceptional 97.7% |
| Cheyenne | 97.9 /100 | #103 | Exceptional 97.7% |
| German Russians | 97.8 /100 | #104 | Exceptional 97.7% |
| Bhutanese | 97.6 /100 | #105 | Exceptional 97.7% |
| Immigrants | Czechoslovakia | 97.5 /100 | #106 | Exceptional 97.7% |
| Immigrants | Singapore | 97.5 /100 | #107 | Exceptional 97.7% |
| Immigrants | Nonimmigrants | 97.3 /100 | #108 | Exceptional 97.7% |
| Immigrants | Latvia | 97.1 /100 | #109 | Exceptional 97.7% |
| Thais | 96.9 /100 | #110 | Exceptional 97.7% |