Tlingit-Haida vs Immigrants from Kenya 11th Grade
COMPARE
Tlingit-Haida
Immigrants from Kenya
11th Grade
11th Grade Comparison
Tlingit-Haida
Immigrants from Kenya
94.4%
11TH GRADE
100.0/ 100
METRIC RATING
21st/ 347
METRIC RANK
92.8%
11TH GRADE
78.7/ 100
METRIC RATING
147th/ 347
METRIC RANK
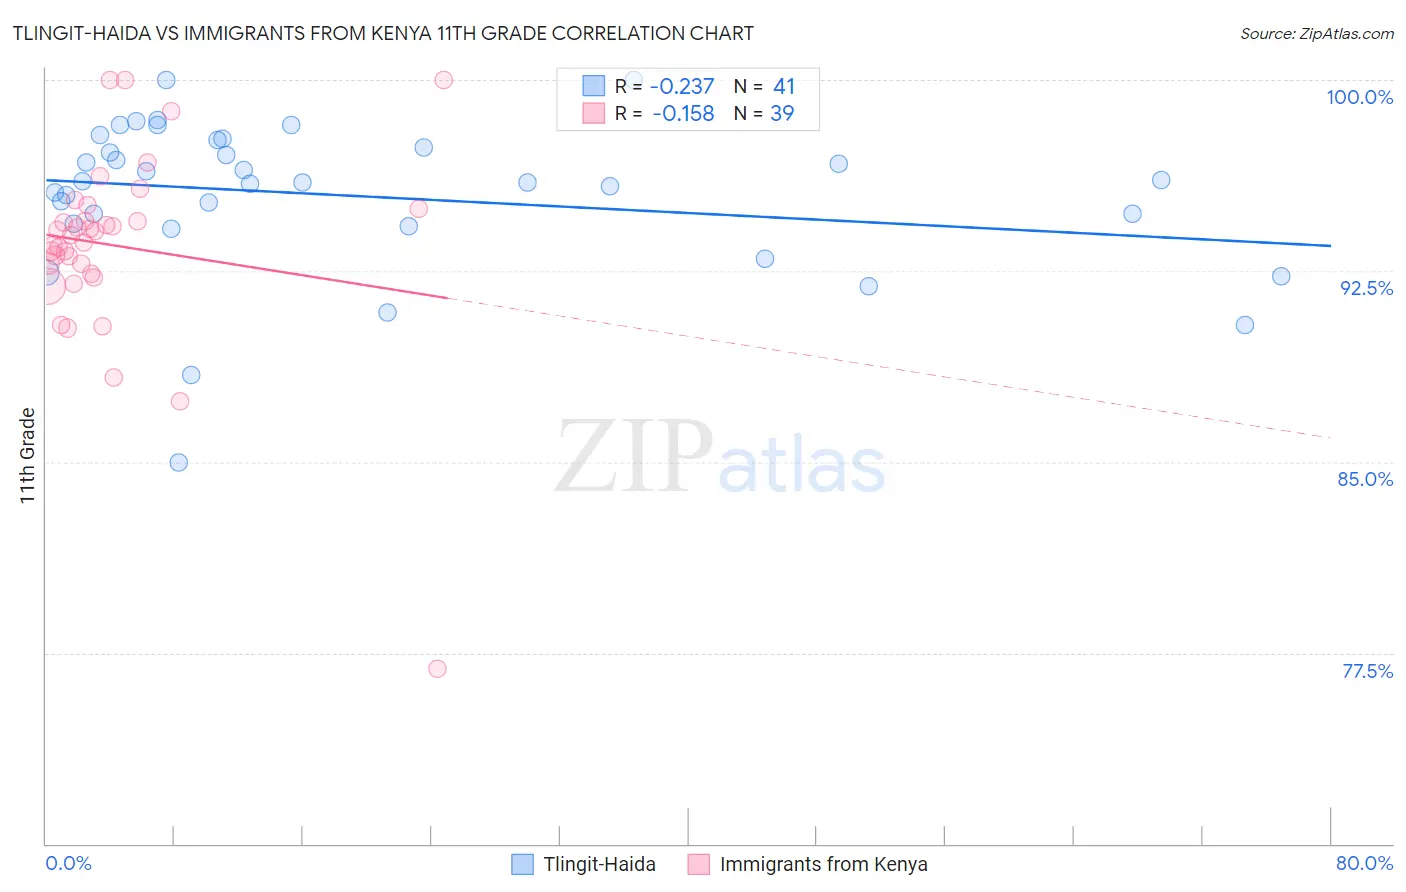
Tlingit-Haida vs Immigrants from Kenya 11th Grade Correlation Chart
The statistical analysis conducted on geographies consisting of 60,871,919 people shows a weak negative correlation between the proportion of Tlingit-Haida and percentage of population with at least 11th grade education in the United States with a correlation coefficient (R) of -0.237 and weighted average of 94.4%. Similarly, the statistical analysis conducted on geographies consisting of 218,076,690 people shows a poor negative correlation between the proportion of Immigrants from Kenya and percentage of population with at least 11th grade education in the United States with a correlation coefficient (R) of -0.158 and weighted average of 92.8%, a difference of 1.8%.
11th Grade Correlation Summary
| Measurement | Tlingit-Haida | Immigrants from Kenya |
| Minimum | 85.0% | 76.9% |
| Maximum | 100.0% | 100.0% |
| Range | 15.0% | 23.1% |
| Mean | 95.4% | 93.5% |
| Median | 96.0% | 93.9% |
| Interquartile 25% (IQ1) | 94.3% | 92.4% |
| Interquartile 75% (IQ3) | 97.5% | 95.0% |
| Interquartile Range (IQR) | 3.2% | 2.6% |
| Standard Deviation (Sample) | 3.0% | 3.9% |
| Standard Deviation (Population) | 3.0% | 3.8% |
Similar Demographics by 11th Grade
Demographics Similar to Tlingit-Haida by 11th Grade
In terms of 11th grade, the demographic groups most similar to Tlingit-Haida are Italian (94.5%, a difference of 0.010%), Tsimshian (94.4%, a difference of 0.010%), Czech (94.4%, a difference of 0.010%), English (94.4%, a difference of 0.040%), and Immigrants from India (94.5%, a difference of 0.050%).
| Demographics | Rating | Rank | 11th Grade |
| Eastern Europeans | 100.0 /100 | #14 | Exceptional 94.6% |
| Bulgarians | 100.0 /100 | #15 | Exceptional 94.5% |
| Immigrants | India | 100.0 /100 | #16 | Exceptional 94.5% |
| Luxembourgers | 100.0 /100 | #17 | Exceptional 94.5% |
| Maltese | 100.0 /100 | #18 | Exceptional 94.5% |
| Scandinavians | 100.0 /100 | #19 | Exceptional 94.5% |
| Italians | 100.0 /100 | #20 | Exceptional 94.5% |
| Tlingit-Haida | 100.0 /100 | #21 | Exceptional 94.4% |
| Tsimshian | 100.0 /100 | #22 | Exceptional 94.4% |
| Czechs | 100.0 /100 | #23 | Exceptional 94.4% |
| English | 100.0 /100 | #24 | Exceptional 94.4% |
| Irish | 100.0 /100 | #25 | Exceptional 94.4% |
| Scottish | 100.0 /100 | #26 | Exceptional 94.4% |
| Europeans | 100.0 /100 | #27 | Exceptional 94.4% |
| Estonians | 100.0 /100 | #28 | Exceptional 94.4% |
Demographics Similar to Immigrants from Kenya by 11th Grade
In terms of 11th grade, the demographic groups most similar to Immigrants from Kenya are Hmong (92.8%, a difference of 0.0%), Immigrants from Poland (92.8%, a difference of 0.0%), Pakistani (92.8%, a difference of 0.010%), Iroquois (92.8%, a difference of 0.010%), and Immigrants from Egypt (92.8%, a difference of 0.020%).
| Demographics | Rating | Rank | 11th Grade |
| Venezuelans | 83.4 /100 | #140 | Excellent 92.9% |
| Chileans | 83.0 /100 | #141 | Excellent 92.9% |
| Kenyans | 82.0 /100 | #142 | Excellent 92.9% |
| Ugandans | 81.4 /100 | #143 | Excellent 92.9% |
| Assyrians/Chaldeans/Syriacs | 80.5 /100 | #144 | Excellent 92.8% |
| Pakistanis | 79.6 /100 | #145 | Good 92.8% |
| Iroquois | 79.1 /100 | #146 | Good 92.8% |
| Immigrants | Kenya | 78.7 /100 | #147 | Good 92.8% |
| Hmong | 78.6 /100 | #148 | Good 92.8% |
| Immigrants | Poland | 78.5 /100 | #149 | Good 92.8% |
| Immigrants | Egypt | 77.5 /100 | #150 | Good 92.8% |
| Potawatomi | 74.3 /100 | #151 | Good 92.8% |
| Iraqis | 74.2 /100 | #152 | Good 92.8% |
| Brazilians | 73.9 /100 | #153 | Good 92.8% |
| Osage | 73.4 /100 | #154 | Good 92.7% |