Thai vs Immigrants from Mexico 9th Grade

COMPARE

Thai
Race
Ancestry
AfghanAfricanAlaska NativeAlaskan AthabascanAlbanianAleutAlsatianAmericanApacheArabArapahoArgentineanArmenianAssyrian/Chaldean/SyriacAustralianAustrianBahamianBangladeshiBarbadianBasqueBelgianBelizeanBermudanBhutaneseBlackfeetBolivianBrazilianBritishBritish West IndianBulgarianBurmeseCajunCambodianCanadianCape VerdeanCarpatho RusynCelticCentral AmericanCentral American IndianCherokeeCheyenneChickasawChileanChineseChippewaChoctawColombianColvilleComancheCosta RicanCreeCreekCroatianCrowCubanCypriotCzechCzechoslovakianDanishDelawareDominicanDutchDutch West IndianEastern EuropeanEcuadorianEgyptianEnglishEstonianEthiopianEuropeanFijianFilipinoFinnishFrenchFrench American IndianFrench CanadianGermanGerman RussianGhanaianGreekGuamanian/ChamorroGuatemalanGuyaneseHaitianHmongHonduranHopiHoumaHungarianIcelanderIndian (Asian)IndonesianInupiatIranianIraqiIrishIroquoisIsraeliItalianJamaicanJapaneseJordanianKenyanKiowaKoreanLaotianLatvianLebaneseLiberianLithuanianLumbeeLuxembourgerMacedonianMalaysianMalteseMarshalleseMenomineeMexicanMexican American IndianMongolianMoroccanNative HawaiianNavajoNepaleseNew ZealanderNicaraguanNigerianNorthern EuropeanNorwegianOkinawanOsageOttawaPaiutePakistaniPalestinianPanamanianParaguayanPennsylvania GermanPeruvianPimaPolishPortuguesePotawatomiPuebloPuerto RicanPuget Sound SalishRomanianRussianSalvadoranSamoanScandinavianScotch-IrishScottishSeminoleSenegaleseSerbianShoshoneSierra LeoneanSiouxSlavicSlovakSloveneSomaliSouth AfricanSouth AmericanSouth American IndianSoviet UnionSpaniardSpanishSpanish AmericanSpanish American IndianSri LankanSubsaharan AfricanSudaneseSwedishSwissSyrianTaiwaneseThaiTlingit-HaidaTohono O'OdhamTonganTrinidadian and TobagonianTsimshianTurkishU.S. Virgin IslanderUgandanUkrainianUruguayanUteVenezuelanVietnameseWelshWest IndianYakamaYaquiYugoslavianYumanYup'ikZimbabwean
Immigration
NonimmigrantsImmigrantsAfghanistanAfricaAlbaniaArgentinaArmeniaAsiaAustraliaAustriaBahamasBangladeshBarbadosBelarusBelgiumBelizeBoliviaBosnia and HerzegovinaBrazilBulgariaBurma/MyanmarCabo VerdeCambodiaCameroonCanadaCaribbeanCentral AmericaChileChinaColombiaCongoCosta RicaCroatiaCubaCzechoslovakiaDenmarkDominicaDominican RepublicEastern AfricaEastern AsiaEastern EuropeEcuadorEgyptEl SalvadorEnglandEritreaEthiopiaEuropeFijiFranceGermanyGhanaGreeceGrenadaGuatemalaGuyanaHaitiHondurasHong KongHungaryIndiaIndonesiaIranIraqIrelandIsraelItalyJamaicaJapanJordanKazakhstanKenyaKoreaKuwaitLaosLatin AmericaLatviaLebanonLiberiaLithuaniaMalaysiaMicronesiaMiddle AfricaMoldovaMoroccoNepalNetherlandsNicaraguaNigeriaNorth AmericaNorth MacedoniaNorthern AfricaNorthern EuropeNorwayOceaniaPakistanPanamaPeruPhilippinesPolandPortugalRomaniaRussiaSaudi ArabiaScotlandSenegalSerbiaSierra LeoneSingaporeSomaliaSouth AfricaSouth AmericaSouth Central AsiaSouth Eastern AsiaSouthern EuropeSpainSri LankaSt. Vincent and the GrenadinesSudanSwedenSwitzerlandSyriaTaiwanThailandTrinidad and TobagoTurkeyUgandaUkraineUruguayUzbekistanVenezuelaVietnamWest IndiesWestern AfricaWestern AsiaWestern EuropeYemenZaireZimbabweAzores
Immigrants from Mexico
Race
Ancestry
AfghanAfricanAlaska NativeAlaskan AthabascanAlbanianAleutAlsatianAmericanApacheArabArapahoArgentineanArmenianAssyrian/Chaldean/SyriacAustralianAustrianBahamianBangladeshiBarbadianBasqueBelgianBelizeanBermudanBhutaneseBlackfeetBolivianBrazilianBritishBritish West IndianBulgarianBurmeseCajunCambodianCanadianCape VerdeanCarpatho RusynCelticCentral AmericanCentral American IndianCherokeeCheyenneChickasawChileanChineseChippewaChoctawColombianColvilleComancheCosta RicanCreeCreekCroatianCrowCubanCypriotCzechCzechoslovakianDanishDelawareDominicanDutchDutch West IndianEastern EuropeanEcuadorianEgyptianEnglishEstonianEthiopianEuropeanFijianFilipinoFinnishFrenchFrench American IndianFrench CanadianGermanGerman RussianGhanaianGreekGuamanian/ChamorroGuatemalanGuyaneseHaitianHmongHonduranHopiHoumaHungarianIcelanderIndian (Asian)IndonesianInupiatIranianIraqiIrishIroquoisIsraeliItalianJamaicanJapaneseJordanianKenyanKiowaKoreanLaotianLatvianLebaneseLiberianLithuanianLumbeeLuxembourgerMacedonianMalaysianMalteseMarshalleseMenomineeMexicanMexican American IndianMongolianMoroccanNative HawaiianNavajoNepaleseNew ZealanderNicaraguanNigerianNorthern EuropeanNorwegianOkinawanOsageOttawaPaiutePakistaniPalestinianPanamanianParaguayanPennsylvania GermanPeruvianPimaPolishPortuguesePotawatomiPuebloPuerto RicanPuget Sound SalishRomanianRussianSalvadoranSamoanScandinavianScotch-IrishScottishSeminoleSenegaleseSerbianShoshoneSierra LeoneanSiouxSlavicSlovakSloveneSomaliSouth AfricanSouth AmericanSouth American IndianSoviet UnionSpaniardSpanishSpanish AmericanSpanish American IndianSri LankanSubsaharan AfricanSudaneseSwedishSwissSyrianTaiwaneseTlingit-HaidaTohono O'OdhamTonganTrinidadian and TobagonianTsimshianTurkishU.S. Virgin IslanderUgandanUkrainianUruguayanUteVenezuelanVietnameseWelshWest IndianYakamaYaquiYugoslavianYumanYup'ikZimbabwean
Immigration
NonimmigrantsImmigrantsAfghanistanAfricaAlbaniaArgentinaArmeniaAsiaAustraliaAustriaBahamasBangladeshBarbadosBelarusBelgiumBelizeBoliviaBosnia and HerzegovinaBrazilBulgariaBurma/MyanmarCabo VerdeCambodiaCameroonCanadaCaribbeanCentral AmericaChileChinaColombiaCongoCosta RicaCroatiaCubaCzechoslovakiaDenmarkDominicaDominican RepublicEastern AfricaEastern AsiaEastern EuropeEcuadorEgyptEl SalvadorEnglandEritreaEthiopiaEuropeFijiFranceGermanyGhanaGreeceGrenadaGuatemalaGuyanaHaitiHondurasHong KongHungaryIndiaIndonesiaIranIraqIrelandIsraelItalyJamaicaJapanJordanKazakhstanKenyaKoreaKuwaitLaosLatin AmericaLatviaLebanonLiberiaLithuaniaMalaysiaMexicoMicronesiaMiddle AfricaMoldovaMoroccoNepalNetherlandsNicaraguaNigeriaNorth AmericaNorth MacedoniaNorthern AfricaNorthern EuropeNorwayOceaniaPakistanPanamaPeruPhilippinesPolandPortugalRomaniaRussiaSaudi ArabiaScotlandSenegalSerbiaSierra LeoneSingaporeSomaliaSouth AfricaSouth AmericaSouth Central AsiaSouth Eastern AsiaSouthern EuropeSpainSri LankaSt. Vincent and the GrenadinesSudanSwedenSwitzerlandSyriaTaiwanThailandTrinidad and TobagoTurkeyUgandaUkraineUruguayUzbekistanVenezuelaVietnamWest IndiesWestern AfricaWestern AsiaWestern EuropeYemenZaireZimbabweAzores
9th Grade
Income
Poverty
Unemployment
Labor Participation
Family Structure
Vehicle Availability
Education Level
Disability

9th Grade Comparison

Thais

Immigrants from Mexico

Exceptional
Tragic
95.8%
9TH GRADE
99.5/ 100
METRIC RATING
74th/ 347
METRIC RANK
88.7%
9TH GRADE
0.0/ 100
METRIC RATING
346th/ 347
METRIC RANK

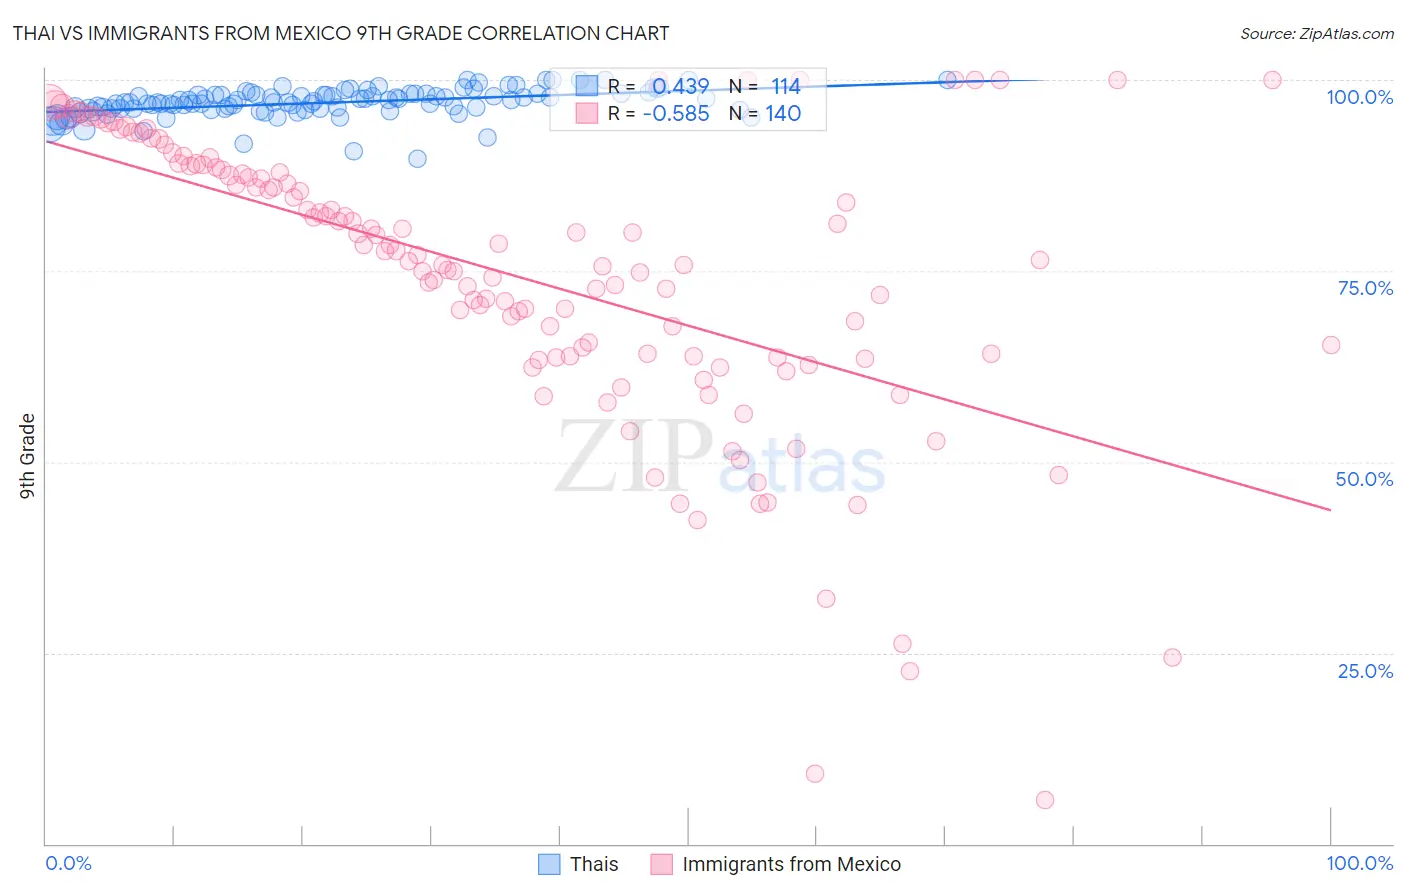
Thai vs Immigrants from Mexico 9th Grade Correlation Chart

The statistical analysis conducted on geographies consisting of 475,814,962 people shows a moderate positive correlation between the proportion of Thais and percentage of population with at least 9th grade education in the United States with a correlation coefficient (R) of 0.439 and weighted average of 95.8%. Similarly, the statistical analysis conducted on geographies consisting of 513,766,901 people shows a substantial negative correlation between the proportion of Immigrants from Mexico and percentage of population with at least 9th grade education in the United States with a correlation coefficient (R) of -0.585 and weighted average of 88.7%, a difference of 8.1%.
Thai vs Immigrants from Mexico 9th Grade

9th Grade Correlation Summary

MeasurementThaiImmigrants from Mexico
Minimum89.8%5.7%
Maximum100.0%100.0%
Range10.2%94.3%
Mean97.0%74.4%
Median97.0%76.8%
Interquartile 25% (IQ1)96.2%63.8%
Interquartile 75% (IQ3)98.1%88.4%
Interquartile Range (IQR)1.9%24.6%
Standard Deviation (Sample)1.8%18.8%
Standard Deviation (Population)1.8%18.7%

Similar Demographics by 9th Grade

Demographics Similar to Thais by 9th Grade

In terms of 9th grade, the demographic groups most similar to Thais are Immigrants from Australia (95.8%, a difference of 0.010%), Immigrants from Belgium (95.8%, a difference of 0.010%), Turkish (95.8%, a difference of 0.010%), Immigrants from Singapore (95.8%, a difference of 0.010%), and Inupiat (95.8%, a difference of 0.010%).
DemographicsRating | Rank9th Grade
Cypriots
99.6
/100
|
#67
Exceptional
95.8%
Immigrants | Ireland
99.6
/100
|
#68
Exceptional
95.8%
Immigrants | Lithuania
99.6
/100
|
#69
Exceptional
95.8%
Immigrants | Australia
99.5
/100
|
#70
Exceptional
95.8%
Immigrants | Belgium
99.5
/100
|
#71
Exceptional
95.8%
Turks
99.5
/100
|
#72
Exceptional
95.8%
Immigrants | Singapore
99.5
/100
|
#73
Exceptional
95.8%
Thais
99.5
/100
|
#74
Exceptional
95.8%
Inupiat
99.5
/100
|
#75
Exceptional
95.8%
Immigrants | Sweden
99.5
/100
|
#76
Exceptional
95.8%
Whites/Caucasians
99.4
/100
|
#77
Exceptional
95.8%
Immigrants | South Africa
99.4
/100
|
#78
Exceptional
95.8%
Romanians
99.3
/100
|
#79
Exceptional
95.7%
Bhutanese
99.3
/100
|
#80
Exceptional
95.7%
Arapaho
99.3
/100
|
#81
Exceptional
95.7%

Demographics Similar to Immigrants from Mexico by 9th Grade

In terms of 9th grade, the demographic groups most similar to Immigrants from Mexico are Immigrants from Central America (89.0%, a difference of 0.34%), Immigrants from El Salvador (89.0%, a difference of 0.36%), Spanish American Indian (88.3%, a difference of 0.43%), Immigrants from Guatemala (89.4%, a difference of 0.87%), and Salvadoran (89.6%, a difference of 1.1%).
DemographicsRating | Rank9th Grade
Immigrants | Yemen
0.0
/100
|
#333
Tragic
90.8%
Immigrants | Azores
0.0
/100
|
#334
Tragic
90.8%
Immigrants | Honduras
0.0
/100
|
#335
Tragic
90.6%
Immigrants | Dominican Republic
0.0
/100
|
#336
Tragic
90.5%
Immigrants | Latin America
0.0
/100
|
#337
Tragic
90.4%
Central Americans
0.0
/100
|
#338
Tragic
90.4%
Yakama
0.0
/100
|
#339
Tragic
90.1%
Mexicans
0.0
/100
|
#340
Tragic
90.0%
Guatemalans
0.0
/100
|
#341
Tragic
89.9%
Salvadorans
0.0
/100
|
#342
Tragic
89.6%
Immigrants | Guatemala
0.0
/100
|
#343
Tragic
89.4%
Immigrants | El Salvador
0.0
/100
|
#344
Tragic
89.0%
Immigrants | Central America
0.0
/100
|
#345
Tragic
89.0%
Immigrants | Mexico
0.0
/100
|
#346
Tragic
88.7%
Spanish American Indians
0.0
/100
|
#347
Tragic
88.3%