Thai vs Immigrants from Guatemala 4th Grade
COMPARE
Thai
Immigrants from Guatemala
4th Grade
4th Grade Comparison
Thais
Immigrants from Guatemala
97.8%
4TH GRADE
96.7/ 100
METRIC RATING
110th/ 347
METRIC RANK
95.1%
4TH GRADE
0.0/ 100
METRIC RATING
343rd/ 347
METRIC RANK
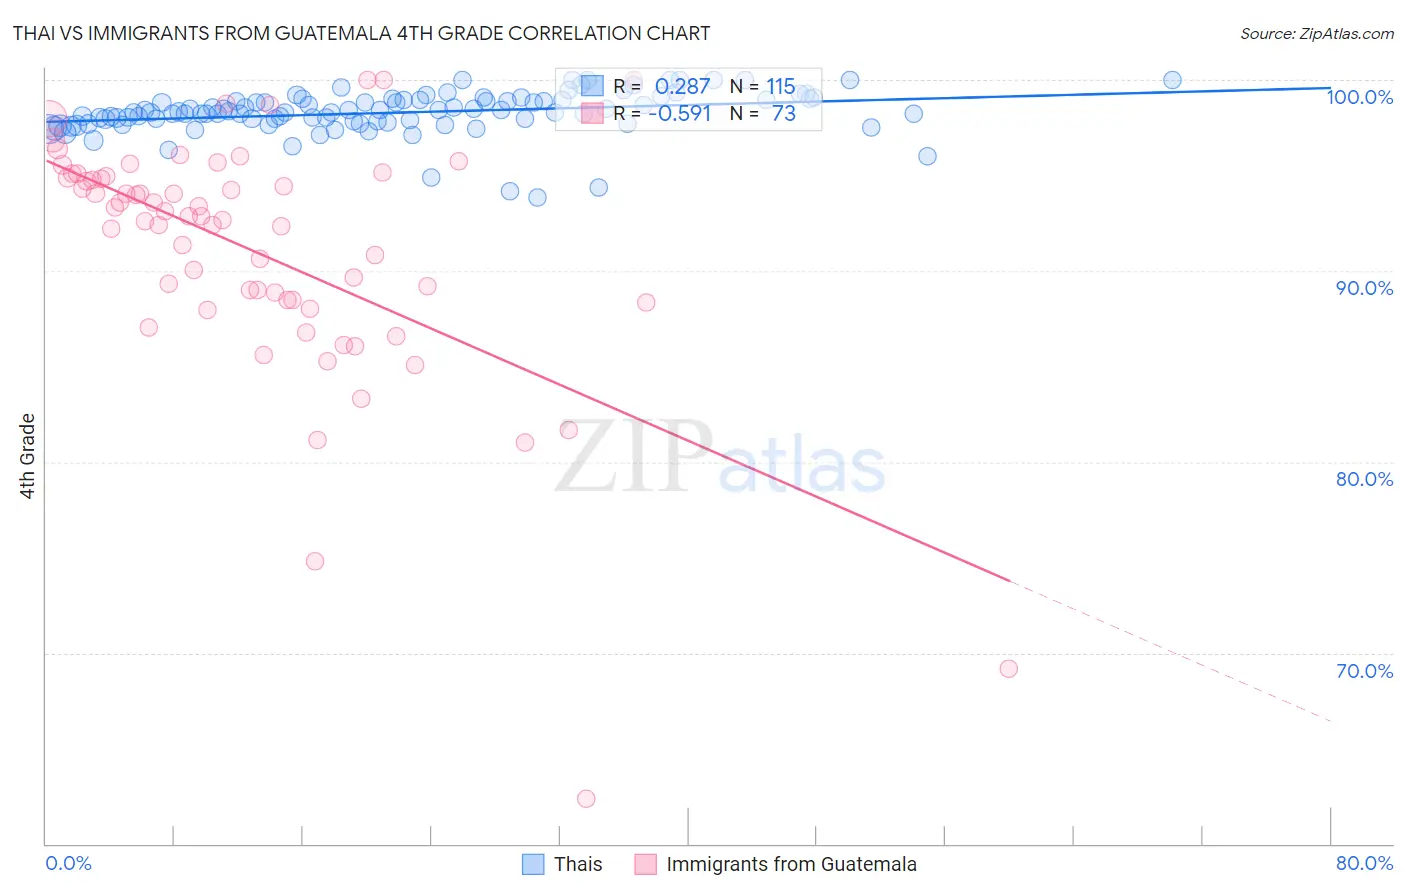
Thai vs Immigrants from Guatemala 4th Grade Correlation Chart
The statistical analysis conducted on geographies consisting of 475,866,115 people shows a weak positive correlation between the proportion of Thais and percentage of population with at least 4th grade education in the United States with a correlation coefficient (R) of 0.287 and weighted average of 97.8%. Similarly, the statistical analysis conducted on geographies consisting of 377,285,993 people shows a substantial negative correlation between the proportion of Immigrants from Guatemala and percentage of population with at least 4th grade education in the United States with a correlation coefficient (R) of -0.591 and weighted average of 95.1%, a difference of 2.9%.
4th Grade Correlation Summary
| Measurement | Thai | Immigrants from Guatemala |
| Minimum | 93.8% | 62.4% |
| Maximum | 100.0% | 100.0% |
| Range | 6.2% | 37.6% |
| Mean | 98.3% | 91.0% |
| Median | 98.3% | 92.9% |
| Interquartile 25% (IQ1) | 97.8% | 88.4% |
| Interquartile 75% (IQ3) | 99.0% | 94.9% |
| Interquartile Range (IQR) | 1.1% | 6.5% |
| Standard Deviation (Sample) | 1.1% | 6.5% |
| Standard Deviation (Population) | 1.1% | 6.4% |
Similar Demographics by 4th Grade
Demographics Similar to Thais by 4th Grade
In terms of 4th grade, the demographic groups most similar to Thais are Immigrants from Latvia (97.8%, a difference of 0.0%), Immigrants from Switzerland (97.8%, a difference of 0.010%), Bhutanese (97.9%, a difference of 0.020%), Immigrants from Singapore (97.9%, a difference of 0.020%), and Okinawan (97.8%, a difference of 0.020%).
| Demographics | Rating | Rank | 4th Grade |
| Puget Sound Salish | 97.7 /100 | #103 | Exceptional 97.9% |
| Immigrants | Nonimmigrants | 97.5 /100 | #104 | Exceptional 97.9% |
| German Russians | 97.5 /100 | #105 | Exceptional 97.9% |
| Immigrants | Czechoslovakia | 97.5 /100 | #106 | Exceptional 97.9% |
| Bhutanese | 97.4 /100 | #107 | Exceptional 97.9% |
| Immigrants | Singapore | 97.3 /100 | #108 | Exceptional 97.9% |
| Immigrants | Latvia | 96.8 /100 | #109 | Exceptional 97.8% |
| Thais | 96.7 /100 | #110 | Exceptional 97.8% |
| Immigrants | Switzerland | 96.1 /100 | #111 | Exceptional 97.8% |
| Okinawans | 96.0 /100 | #112 | Exceptional 97.8% |
| Basques | 95.8 /100 | #113 | Exceptional 97.8% |
| Iroquois | 95.4 /100 | #114 | Exceptional 97.8% |
| Lebanese | 95.4 /100 | #115 | Exceptional 97.8% |
| Immigrants | Croatia | 95.2 /100 | #116 | Exceptional 97.8% |
| Syrians | 94.9 /100 | #117 | Exceptional 97.8% |
Demographics Similar to Immigrants from Guatemala by 4th Grade
In terms of 4th grade, the demographic groups most similar to Immigrants from Guatemala are Immigrants from Central America (95.1%, a difference of 0.030%), Immigrants from Mexico (95.1%, a difference of 0.030%), Salvadoran (95.0%, a difference of 0.040%), Immigrants from Yemen (95.2%, a difference of 0.11%), and Yakama (95.2%, a difference of 0.12%).
| Demographics | Rating | Rank | 4th Grade |
| Immigrants | Dominican Republic | 0.0 /100 | #333 | Tragic 95.7% |
| Immigrants | Cabo Verde | 0.0 /100 | #334 | Tragic 95.7% |
| Immigrants | Latin America | 0.0 /100 | #335 | Tragic 95.7% |
| Mexicans | 0.0 /100 | #336 | Tragic 95.6% |
| Central Americans | 0.0 /100 | #337 | Tragic 95.5% |
| Nepalese | 0.0 /100 | #338 | Tragic 95.5% |
| Guatemalans | 0.0 /100 | #339 | Tragic 95.3% |
| Yakama | 0.0 /100 | #340 | Tragic 95.2% |
| Immigrants | Yemen | 0.0 /100 | #341 | Tragic 95.2% |
| Immigrants | Central America | 0.0 /100 | #342 | Tragic 95.1% |
| Immigrants | Guatemala | 0.0 /100 | #343 | Tragic 95.1% |
| Immigrants | Mexico | 0.0 /100 | #344 | Tragic 95.1% |
| Salvadorans | 0.0 /100 | #345 | Tragic 95.0% |
| Immigrants | El Salvador | 0.0 /100 | #346 | Tragic 94.8% |
| Spanish American Indians | 0.0 /100 | #347 | Tragic 94.6% |