Taiwanese vs Immigrants from Israel 1st Grade
COMPARE
Taiwanese
Immigrants from Israel
1st Grade
1st Grade Comparison
Taiwanese
Immigrants from Israel
97.5%
1ST GRADE
0.4/ 100
METRIC RATING
264th/ 347
METRIC RANK
98.0%
1ST GRADE
77.8/ 100
METRIC RATING
146th/ 347
METRIC RANK
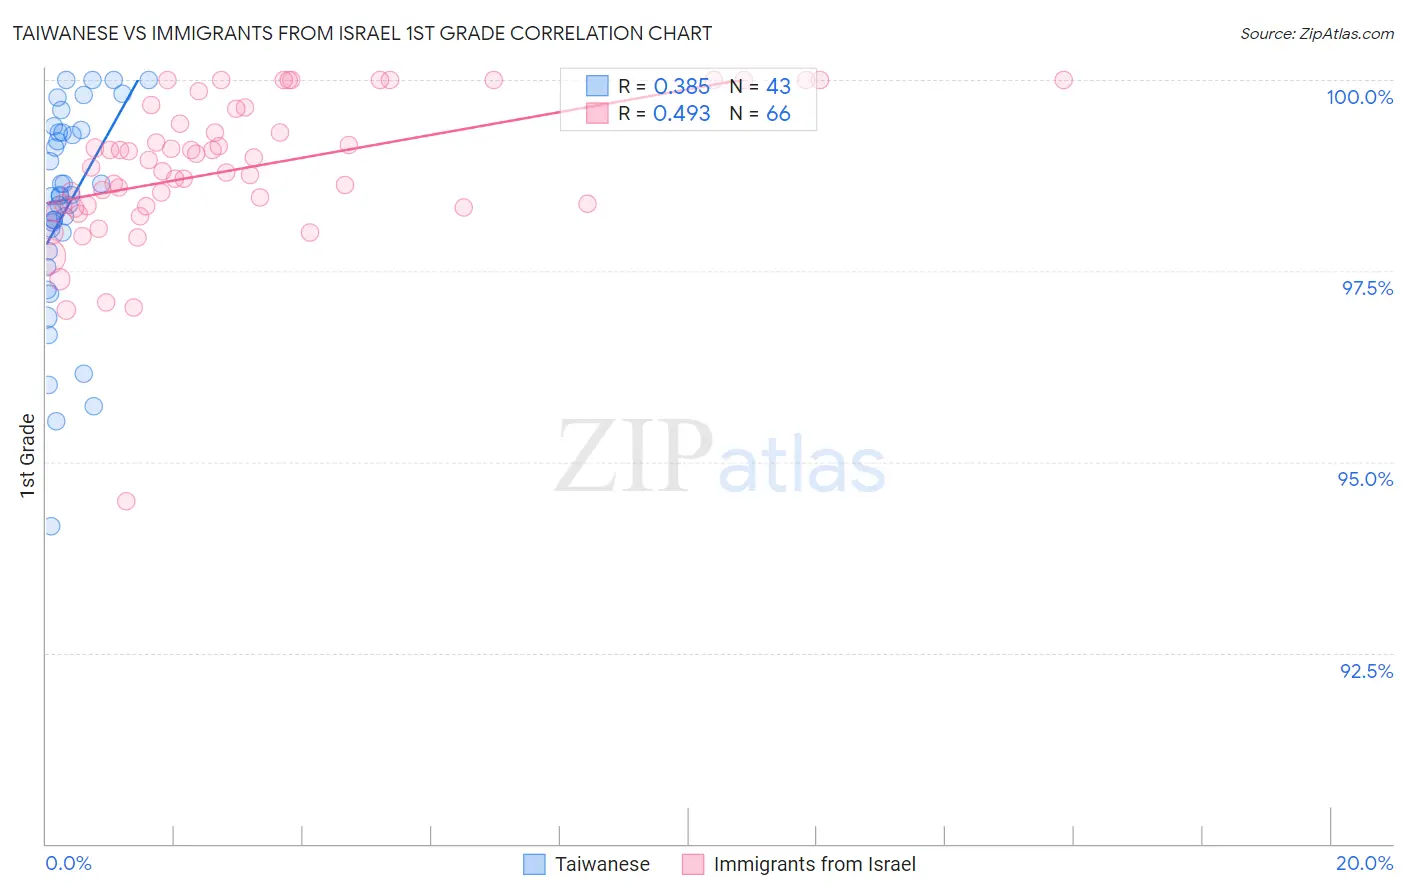
Taiwanese vs Immigrants from Israel 1st Grade Correlation Chart
The statistical analysis conducted on geographies consisting of 31,677,387 people shows a mild positive correlation between the proportion of Taiwanese and percentage of population with at least 1st grade education in the United States with a correlation coefficient (R) of 0.385 and weighted average of 97.5%. Similarly, the statistical analysis conducted on geographies consisting of 210,029,773 people shows a moderate positive correlation between the proportion of Immigrants from Israel and percentage of population with at least 1st grade education in the United States with a correlation coefficient (R) of 0.493 and weighted average of 98.0%, a difference of 0.53%.
1st Grade Correlation Summary
| Measurement | Taiwanese | Immigrants from Israel |
| Minimum | 94.2% | 94.5% |
| Maximum | 100.0% | 100.0% |
| Range | 5.8% | 5.5% |
| Mean | 98.3% | 98.8% |
| Median | 98.5% | 98.9% |
| Interquartile 25% (IQ1) | 97.8% | 98.4% |
| Interquartile 75% (IQ3) | 99.3% | 99.6% |
| Interquartile Range (IQR) | 1.6% | 1.3% |
| Standard Deviation (Sample) | 1.4% | 0.97% |
| Standard Deviation (Population) | 1.3% | 0.96% |
Similar Demographics by 1st Grade
Demographics Similar to Taiwanese by 1st Grade
In terms of 1st grade, the demographic groups most similar to Taiwanese are Assyrian/Chaldean/Syriac (97.5%, a difference of 0.0%), Immigrants from South America (97.5%, a difference of 0.0%), Immigrants from Ethiopia (97.5%, a difference of 0.010%), Cuban (97.5%, a difference of 0.010%), and Immigrants from Liberia (97.5%, a difference of 0.010%).
| Demographics | Rating | Rank | 1st Grade |
| Yaqui | 0.6 /100 | #257 | Tragic 97.5% |
| Indians (Asian) | 0.6 /100 | #258 | Tragic 97.5% |
| Fijians | 0.5 /100 | #259 | Tragic 97.5% |
| Armenians | 0.5 /100 | #260 | Tragic 97.5% |
| Immigrants | Ethiopia | 0.4 /100 | #261 | Tragic 97.5% |
| Assyrians/Chaldeans/Syriacs | 0.4 /100 | #262 | Tragic 97.5% |
| Immigrants | South America | 0.4 /100 | #263 | Tragic 97.5% |
| Taiwanese | 0.4 /100 | #264 | Tragic 97.5% |
| Cubans | 0.3 /100 | #265 | Tragic 97.5% |
| Immigrants | Liberia | 0.3 /100 | #266 | Tragic 97.5% |
| Immigrants | Sierra Leone | 0.3 /100 | #267 | Tragic 97.5% |
| Immigrants | Nigeria | 0.3 /100 | #268 | Tragic 97.5% |
| West Indians | 0.3 /100 | #269 | Tragic 97.5% |
| Immigrants | Jamaica | 0.2 /100 | #270 | Tragic 97.5% |
| Immigrants | Cameroon | 0.2 /100 | #271 | Tragic 97.4% |
Demographics Similar to Immigrants from Israel by 1st Grade
In terms of 1st grade, the demographic groups most similar to Immigrants from Israel are Filipino (98.0%, a difference of 0.0%), Burmese (98.0%, a difference of 0.010%), Alsatian (98.0%, a difference of 0.010%), Hmong (98.0%, a difference of 0.010%), and Apache (98.0%, a difference of 0.010%).
| Demographics | Rating | Rank | 1st Grade |
| Blackfeet | 87.6 /100 | #139 | Excellent 98.1% |
| Palestinians | 83.0 /100 | #140 | Excellent 98.0% |
| Immigrants | Turkey | 82.8 /100 | #141 | Excellent 98.0% |
| Marshallese | 82.0 /100 | #142 | Excellent 98.0% |
| Burmese | 81.0 /100 | #143 | Excellent 98.0% |
| Alsatians | 80.9 /100 | #144 | Excellent 98.0% |
| Hmong | 79.0 /100 | #145 | Good 98.0% |
| Immigrants | Israel | 77.8 /100 | #146 | Good 98.0% |
| Filipinos | 77.6 /100 | #147 | Good 98.0% |
| Apache | 75.2 /100 | #148 | Good 98.0% |
| Immigrants | Greece | 74.9 /100 | #149 | Good 98.0% |
| Jordanians | 72.7 /100 | #150 | Good 98.0% |
| Dutch West Indians | 69.8 /100 | #151 | Good 98.0% |
| Immigrants | Moldova | 69.5 /100 | #152 | Good 98.0% |
| Soviet Union | 68.9 /100 | #153 | Good 98.0% |