Taiwanese vs Greek 6th Grade
COMPARE
Taiwanese
Greek
6th Grade
6th Grade Comparison
Taiwanese
Greeks
96.5%
6TH GRADE
0.5/ 100
METRIC RATING
257th/ 347
METRIC RANK
97.7%
6TH GRADE
99.8/ 100
METRIC RATING
58th/ 347
METRIC RANK
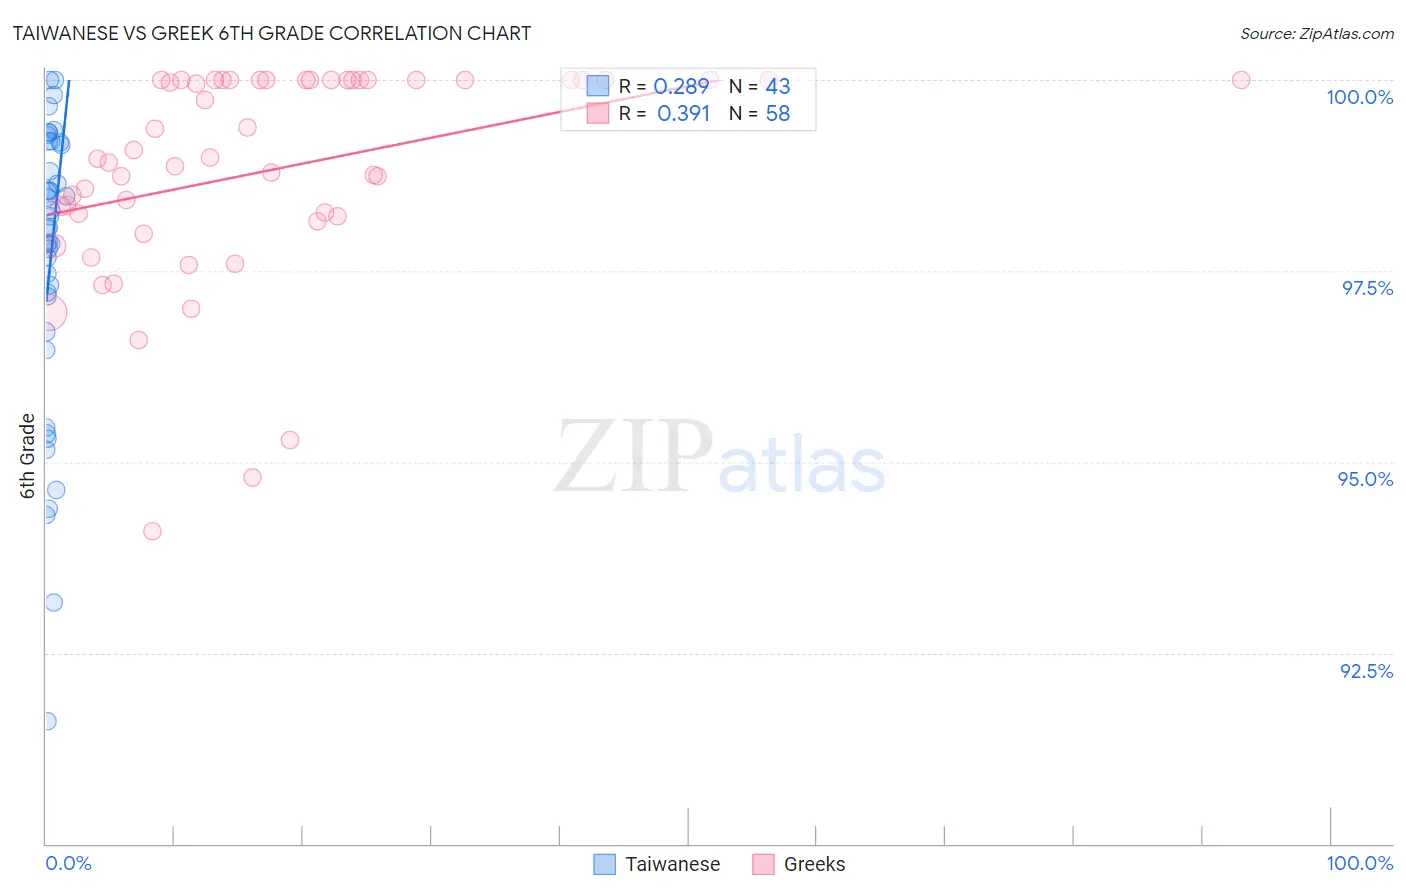
Taiwanese vs Greek 6th Grade Correlation Chart
The statistical analysis conducted on geographies consisting of 31,677,387 people shows a weak positive correlation between the proportion of Taiwanese and percentage of population with at least 6th grade education in the United States with a correlation coefficient (R) of 0.289 and weighted average of 96.5%. Similarly, the statistical analysis conducted on geographies consisting of 482,775,358 people shows a mild positive correlation between the proportion of Greeks and percentage of population with at least 6th grade education in the United States with a correlation coefficient (R) of 0.391 and weighted average of 97.7%, a difference of 1.3%.
6th Grade Correlation Summary
| Measurement | Taiwanese | Greek |
| Minimum | 91.6% | 94.1% |
| Maximum | 100.0% | 100.0% |
| Range | 8.4% | 5.9% |
| Mean | 97.6% | 98.8% |
| Median | 98.1% | 99.0% |
| Interquartile 25% (IQ1) | 96.7% | 98.2% |
| Interquartile 75% (IQ3) | 99.2% | 100.0% |
| Interquartile Range (IQR) | 2.5% | 1.8% |
| Standard Deviation (Sample) | 2.0% | 1.4% |
| Standard Deviation (Population) | 1.9% | 1.4% |
Similar Demographics by 6th Grade
Demographics Similar to Taiwanese by 6th Grade
In terms of 6th grade, the demographic groups most similar to Taiwanese are Immigrants from China (96.4%, a difference of 0.010%), Immigrants from Ethiopia (96.5%, a difference of 0.020%), Immigrants from Congo (96.5%, a difference of 0.020%), U.S. Virgin Islander (96.5%, a difference of 0.020%), and South American (96.4%, a difference of 0.020%).
| Demographics | Rating | Rank | 6th Grade |
| Immigrants | Middle Africa | 0.8 /100 | #250 | Tragic 96.5% |
| Immigrants | Senegal | 0.7 /100 | #251 | Tragic 96.5% |
| Immigrants | Uruguay | 0.6 /100 | #252 | Tragic 96.5% |
| Jamaicans | 0.6 /100 | #253 | Tragic 96.5% |
| Immigrants | Ethiopia | 0.6 /100 | #254 | Tragic 96.5% |
| Immigrants | Congo | 0.6 /100 | #255 | Tragic 96.5% |
| U.S. Virgin Islanders | 0.5 /100 | #256 | Tragic 96.5% |
| Taiwanese | 0.5 /100 | #257 | Tragic 96.5% |
| Immigrants | China | 0.4 /100 | #258 | Tragic 96.4% |
| South Americans | 0.4 /100 | #259 | Tragic 96.4% |
| Peruvians | 0.4 /100 | #260 | Tragic 96.4% |
| Immigrants | Sierra Leone | 0.4 /100 | #261 | Tragic 96.4% |
| Immigrants | Nigeria | 0.3 /100 | #262 | Tragic 96.4% |
| Immigrants | Colombia | 0.3 /100 | #263 | Tragic 96.4% |
| Armenians | 0.3 /100 | #264 | Tragic 96.4% |
Demographics Similar to Greeks by 6th Grade
In terms of 6th grade, the demographic groups most similar to Greeks are White/Caucasian (97.7%, a difference of 0.0%), Austrian (97.7%, a difference of 0.010%), American (97.7%, a difference of 0.010%), Immigrants from Canada (97.7%, a difference of 0.010%), and Creek (97.7%, a difference of 0.020%).
| Demographics | Rating | Rank | 6th Grade |
| Maltese | 99.8 /100 | #51 | Exceptional 97.8% |
| Australians | 99.8 /100 | #52 | Exceptional 97.8% |
| Slavs | 99.8 /100 | #53 | Exceptional 97.8% |
| Creek | 99.8 /100 | #54 | Exceptional 97.7% |
| Aleuts | 99.8 /100 | #55 | Exceptional 97.7% |
| Austrians | 99.8 /100 | #56 | Exceptional 97.7% |
| Whites/Caucasians | 99.8 /100 | #57 | Exceptional 97.7% |
| Greeks | 99.8 /100 | #58 | Exceptional 97.7% |
| Americans | 99.8 /100 | #59 | Exceptional 97.7% |
| Immigrants | Canada | 99.8 /100 | #60 | Exceptional 97.7% |
| Serbians | 99.7 /100 | #61 | Exceptional 97.7% |
| Immigrants | North America | 99.7 /100 | #62 | Exceptional 97.7% |
| Russians | 99.7 /100 | #63 | Exceptional 97.7% |
| Canadians | 99.7 /100 | #64 | Exceptional 97.7% |
| Immigrants | Northern Europe | 99.6 /100 | #65 | Exceptional 97.7% |