Syrian vs Dutch West Indian 3rd Grade
COMPARE
Syrian
Dutch West Indian
3rd Grade
3rd Grade Comparison
Syrians
Dutch West Indians
98.0%
3RD GRADE
93.8/ 100
METRIC RATING
123rd/ 347
METRIC RANK
97.8%
3RD GRADE
55.5/ 100
METRIC RATING
166th/ 347
METRIC RANK
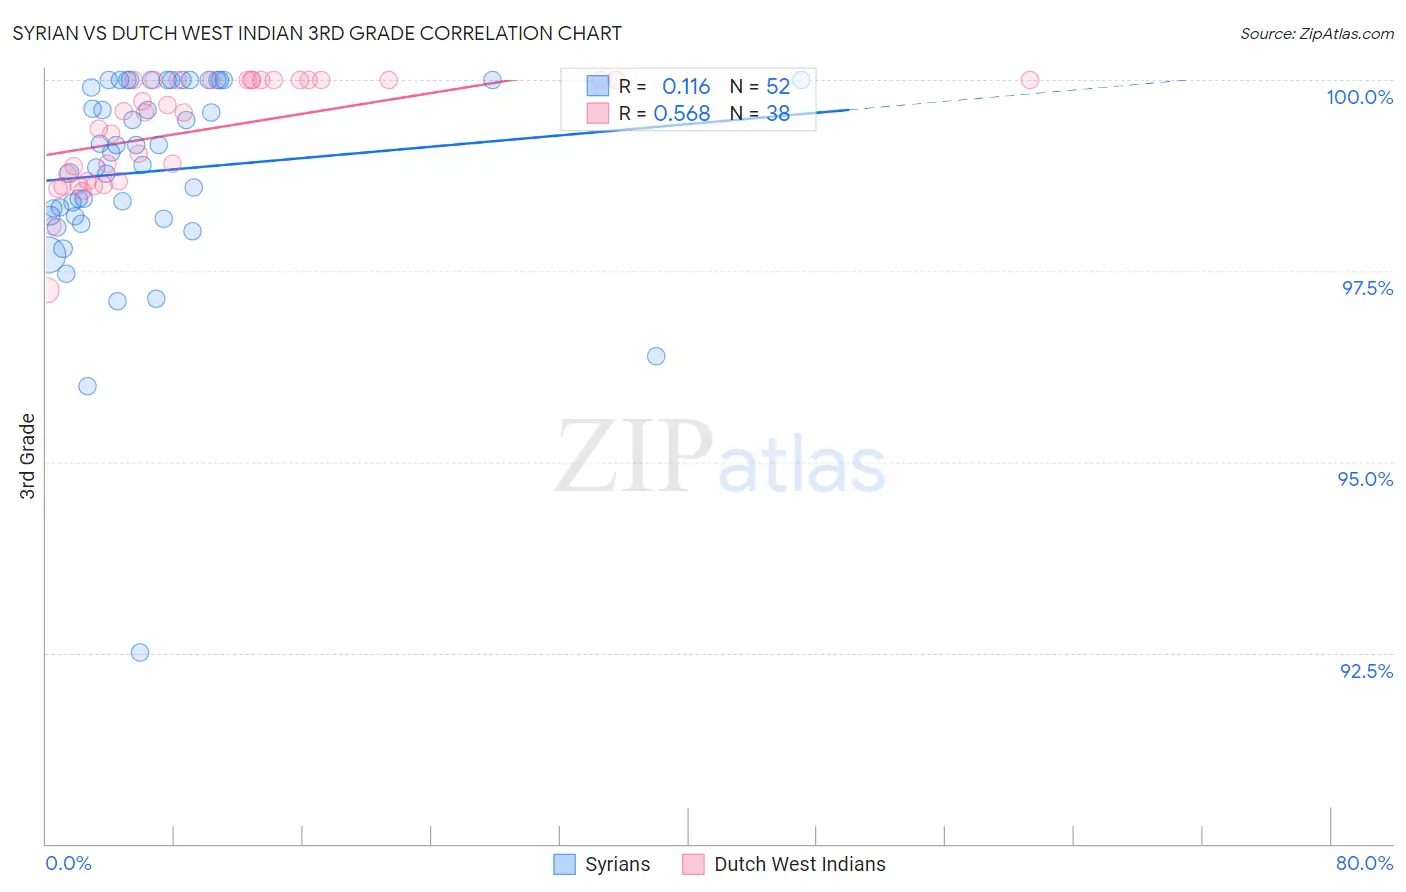
Syrian vs Dutch West Indian 3rd Grade Correlation Chart
The statistical analysis conducted on geographies consisting of 266,305,988 people shows a poor positive correlation between the proportion of Syrians and percentage of population with at least 3rd grade education in the United States with a correlation coefficient (R) of 0.116 and weighted average of 98.0%. Similarly, the statistical analysis conducted on geographies consisting of 85,776,075 people shows a substantial positive correlation between the proportion of Dutch West Indians and percentage of population with at least 3rd grade education in the United States with a correlation coefficient (R) of 0.568 and weighted average of 97.8%, a difference of 0.21%.
3rd Grade Correlation Summary
| Measurement | Syrian | Dutch West Indian |
| Minimum | 92.5% | 97.2% |
| Maximum | 100.0% | 100.0% |
| Range | 7.5% | 2.8% |
| Mean | 98.8% | 99.4% |
| Median | 99.1% | 99.6% |
| Interquartile 25% (IQ1) | 98.2% | 98.7% |
| Interquartile 75% (IQ3) | 100.0% | 100.0% |
| Interquartile Range (IQR) | 1.8% | 1.3% |
| Standard Deviation (Sample) | 1.4% | 0.71% |
| Standard Deviation (Population) | 1.3% | 0.70% |
Similar Demographics by 3rd Grade
Demographics Similar to Syrians by 3rd Grade
In terms of 3rd grade, the demographic groups most similar to Syrians are Immigrants from Japan (98.0%, a difference of 0.0%), Immigrants from Saudi Arabia (98.0%, a difference of 0.0%), Immigrants from Croatia (98.0%, a difference of 0.010%), Iroquois (98.0%, a difference of 0.010%), and Lebanese (98.0%, a difference of 0.010%).
| Demographics | Rating | Rank | 3rd Grade |
| Immigrants | Norway | 95.2 /100 | #116 | Exceptional 98.0% |
| Immigrants | France | 95.1 /100 | #117 | Exceptional 98.0% |
| Iranians | 94.9 /100 | #118 | Exceptional 98.0% |
| Spanish | 94.8 /100 | #119 | Exceptional 98.0% |
| Immigrants | Croatia | 94.4 /100 | #120 | Exceptional 98.0% |
| Iroquois | 94.1 /100 | #121 | Exceptional 98.0% |
| Lebanese | 94.1 /100 | #122 | Exceptional 98.0% |
| Syrians | 93.8 /100 | #123 | Exceptional 98.0% |
| Immigrants | Japan | 93.7 /100 | #124 | Exceptional 98.0% |
| Immigrants | Saudi Arabia | 93.5 /100 | #125 | Exceptional 98.0% |
| Immigrants | Zimbabwe | 93.4 /100 | #126 | Exceptional 98.0% |
| Ute | 93.2 /100 | #127 | Exceptional 98.0% |
| Colville | 92.1 /100 | #128 | Exceptional 98.0% |
| Immigrants | Serbia | 91.9 /100 | #129 | Exceptional 98.0% |
| Immigrants | Europe | 91.2 /100 | #130 | Exceptional 98.0% |
Demographics Similar to Dutch West Indians by 3rd Grade
In terms of 3rd grade, the demographic groups most similar to Dutch West Indians are Immigrants from Bosnia and Herzegovina (97.8%, a difference of 0.0%), Ugandan (97.8%, a difference of 0.0%), Chilean (97.8%, a difference of 0.0%), Immigrants from Spain (97.8%, a difference of 0.0%), and Immigrants from Iran (97.8%, a difference of 0.010%).
| Demographics | Rating | Rank | 3rd Grade |
| French American Indians | 60.0 /100 | #159 | Average 97.8% |
| Immigrants | Iran | 59.1 /100 | #160 | Average 97.8% |
| Albanians | 58.8 /100 | #161 | Average 97.8% |
| Immigrants | Jordan | 57.9 /100 | #162 | Average 97.8% |
| Marshallese | 57.2 /100 | #163 | Average 97.8% |
| Immigrants | Bosnia and Herzegovina | 56.2 /100 | #164 | Average 97.8% |
| Ugandans | 56.1 /100 | #165 | Average 97.8% |
| Dutch West Indians | 55.5 /100 | #166 | Average 97.8% |
| Chileans | 55.3 /100 | #167 | Average 97.8% |
| Immigrants | Spain | 54.3 /100 | #168 | Average 97.8% |
| Comanche | 53.8 /100 | #169 | Average 97.8% |
| Brazilians | 53.7 /100 | #170 | Average 97.8% |
| Kenyans | 51.8 /100 | #171 | Average 97.8% |
| Spanish Americans | 51.8 /100 | #172 | Average 97.8% |
| Immigrants | Korea | 50.9 /100 | #173 | Average 97.8% |