Swedish vs Mongolian 4th Grade
COMPARE
Swedish
Mongolian
4th Grade
4th Grade Comparison
Swedes
Mongolians
98.4%
4TH GRADE
100.0/ 100
METRIC RATING
13th/ 347
METRIC RANK
97.5%
4TH GRADE
34.7/ 100
METRIC RATING
187th/ 347
METRIC RANK
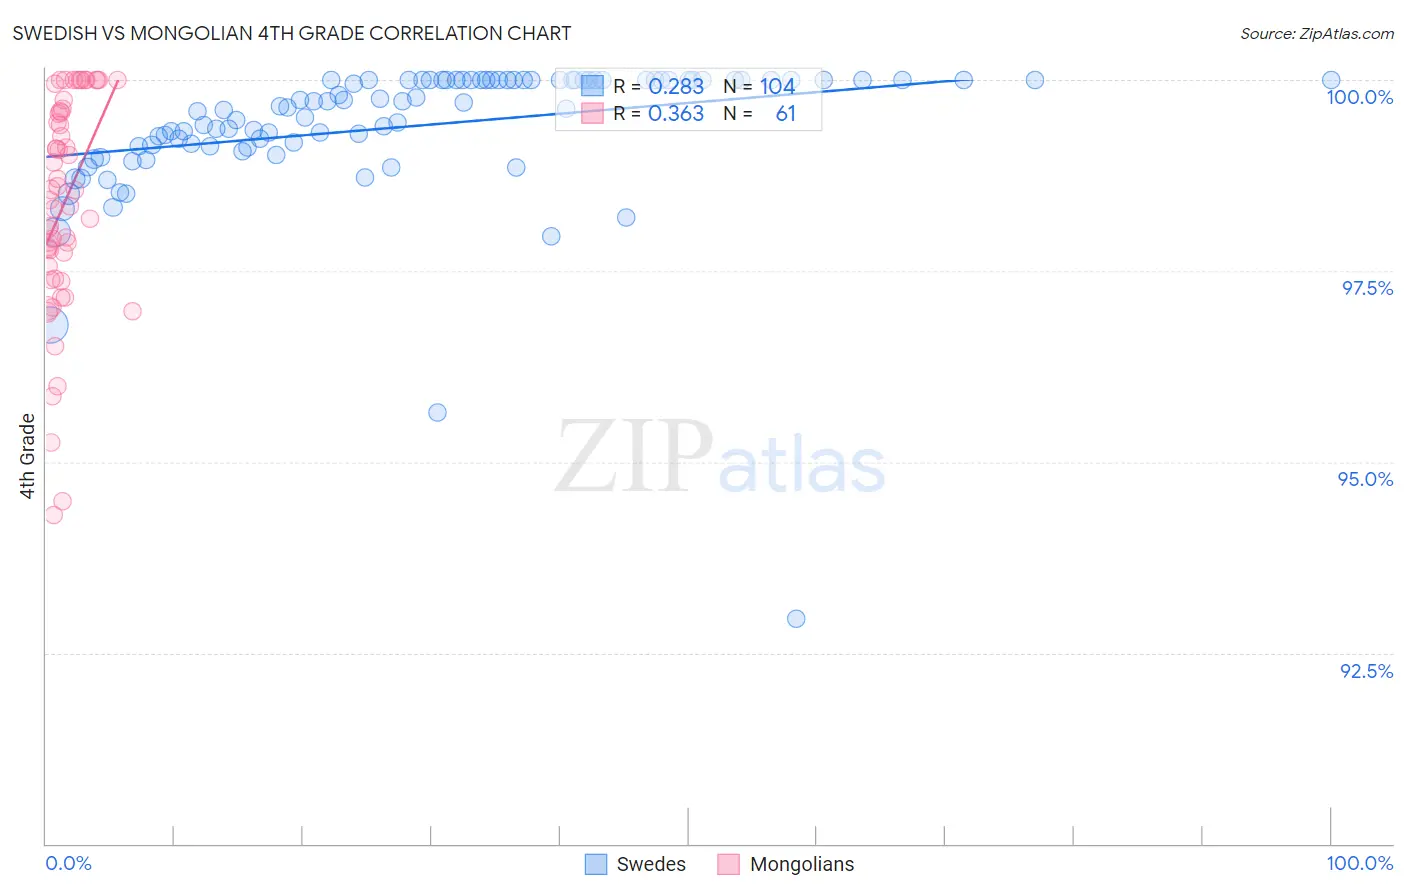
Swedish vs Mongolian 4th Grade Correlation Chart
The statistical analysis conducted on geographies consisting of 539,231,492 people shows a weak positive correlation between the proportion of Swedes and percentage of population with at least 4th grade education in the United States with a correlation coefficient (R) of 0.283 and weighted average of 98.4%. Similarly, the statistical analysis conducted on geographies consisting of 140,362,004 people shows a mild positive correlation between the proportion of Mongolians and percentage of population with at least 4th grade education in the United States with a correlation coefficient (R) of 0.363 and weighted average of 97.5%, a difference of 0.98%.
4th Grade Correlation Summary
| Measurement | Swedish | Mongolian |
| Minimum | 92.9% | 94.3% |
| Maximum | 100.0% | 100.0% |
| Range | 7.1% | 5.7% |
| Mean | 99.4% | 98.4% |
| Median | 99.7% | 98.6% |
| Interquartile 25% (IQ1) | 99.1% | 97.5% |
| Interquartile 75% (IQ3) | 100.0% | 99.6% |
| Interquartile Range (IQR) | 0.87% | 2.1% |
| Standard Deviation (Sample) | 0.95% | 1.4% |
| Standard Deviation (Population) | 0.95% | 1.4% |
Similar Demographics by 4th Grade
Demographics Similar to Swedes by 4th Grade
In terms of 4th grade, the demographic groups most similar to Swedes are English (98.4%, a difference of 0.0%), Tlingit-Haida (98.4%, a difference of 0.0%), Alaskan Athabascan (98.4%, a difference of 0.010%), Carpatho Rusyn (98.4%, a difference of 0.010%), and Slovene (98.4%, a difference of 0.030%).
| Demographics | Rating | Rank | 4th Grade |
| Norwegians | 100.0 /100 | #6 | Exceptional 98.5% |
| Slovaks | 100.0 /100 | #7 | Exceptional 98.5% |
| Germans | 100.0 /100 | #8 | Exceptional 98.5% |
| Slovenes | 100.0 /100 | #9 | Exceptional 98.4% |
| Alaskan Athabascans | 100.0 /100 | #10 | Exceptional 98.4% |
| English | 100.0 /100 | #11 | Exceptional 98.4% |
| Tlingit-Haida | 100.0 /100 | #12 | Exceptional 98.4% |
| Swedes | 100.0 /100 | #13 | Exceptional 98.4% |
| Carpatho Rusyns | 100.0 /100 | #14 | Exceptional 98.4% |
| Dutch | 100.0 /100 | #15 | Exceptional 98.4% |
| Scottish | 100.0 /100 | #16 | Exceptional 98.4% |
| Pennsylvania Germans | 100.0 /100 | #17 | Exceptional 98.4% |
| Poles | 100.0 /100 | #18 | Exceptional 98.4% |
| Irish | 100.0 /100 | #19 | Exceptional 98.4% |
| Alaska Natives | 100.0 /100 | #20 | Exceptional 98.4% |
Demographics Similar to Mongolians by 4th Grade
In terms of 4th grade, the demographic groups most similar to Mongolians are Immigrants from Kenya (97.5%, a difference of 0.0%), Dutch West Indian (97.5%, a difference of 0.0%), Immigrants from Argentina (97.5%, a difference of 0.0%), Pakistani (97.5%, a difference of 0.010%), and Panamanian (97.4%, a difference of 0.010%).
| Demographics | Rating | Rank | 4th Grade |
| Immigrants | Venezuela | 42.7 /100 | #180 | Average 97.5% |
| Immigrants | Taiwan | 41.5 /100 | #181 | Average 97.5% |
| Spanish Americans | 39.3 /100 | #182 | Fair 97.5% |
| Argentineans | 39.0 /100 | #183 | Fair 97.5% |
| Pakistanis | 36.2 /100 | #184 | Fair 97.5% |
| Immigrants | Kenya | 35.8 /100 | #185 | Fair 97.5% |
| Dutch West Indians | 35.8 /100 | #186 | Fair 97.5% |
| Mongolians | 34.7 /100 | #187 | Fair 97.5% |
| Immigrants | Argentina | 34.6 /100 | #188 | Fair 97.5% |
| Panamanians | 31.9 /100 | #189 | Fair 97.4% |
| Blacks/African Americans | 31.1 /100 | #190 | Fair 97.4% |
| Navajo | 30.7 /100 | #191 | Fair 97.4% |
| Immigrants | Ukraine | 30.1 /100 | #192 | Fair 97.4% |
| Immigrants | Egypt | 30.1 /100 | #193 | Fair 97.4% |
| Portuguese | 29.2 /100 | #194 | Fair 97.4% |