Subsaharan African vs Immigrants from Korea Kindergarten
COMPARE
Subsaharan African
Immigrants from Korea
Kindergarten
Kindergarten Comparison
Sub-Saharan Africans
Immigrants from Korea
97.7%
KINDERGARTEN
3.5/ 100
METRIC RATING
228th/ 347
METRIC RANK
98.0%
KINDERGARTEN
54.1/ 100
METRIC RATING
169th/ 347
METRIC RANK
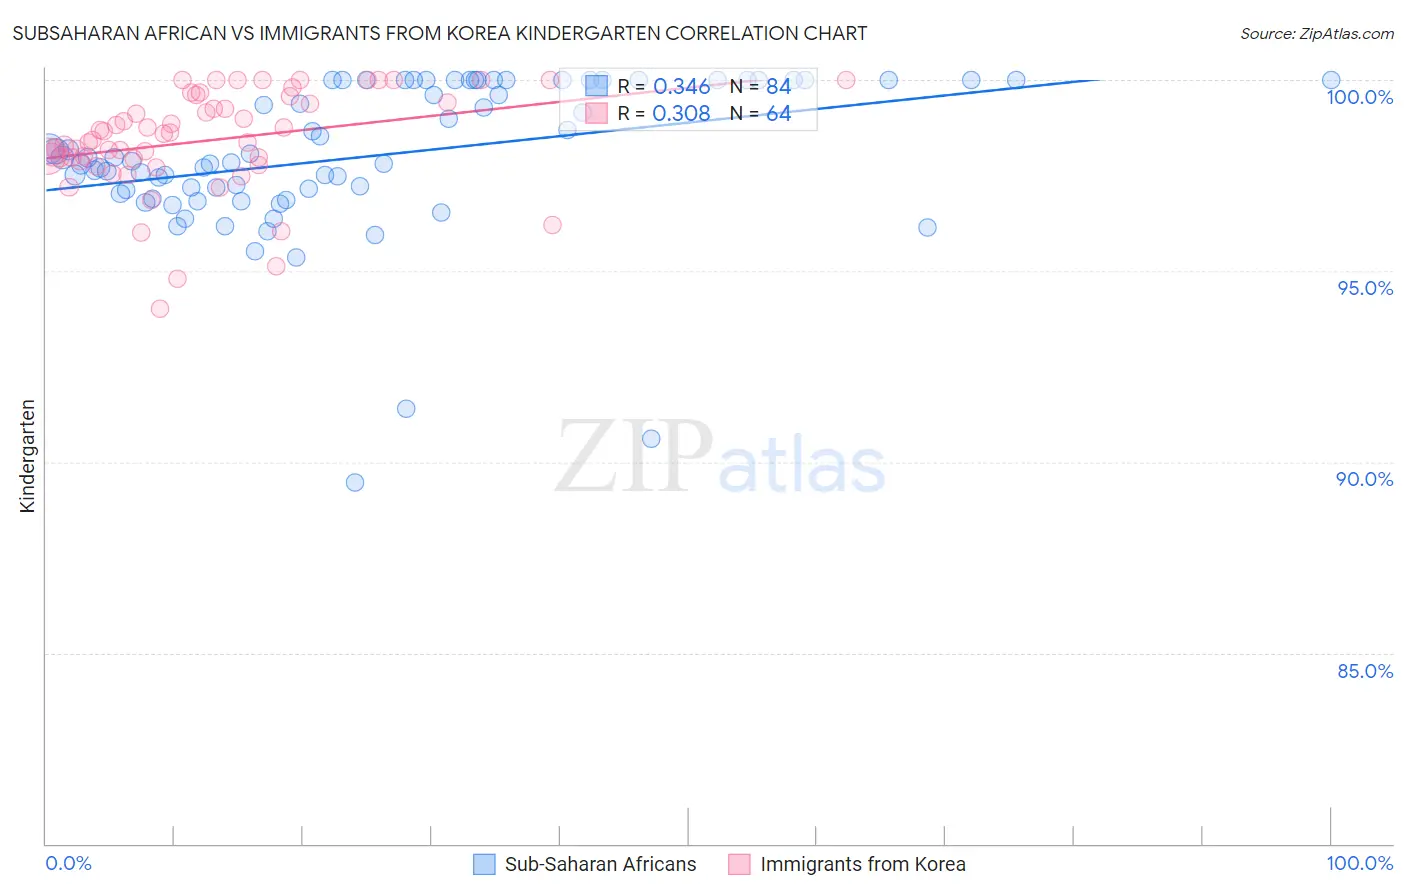
Subsaharan African vs Immigrants from Korea Kindergarten Correlation Chart
The statistical analysis conducted on geographies consisting of 508,209,936 people shows a mild positive correlation between the proportion of Sub-Saharan Africans and percentage of population with at least kindergarten education in the United States with a correlation coefficient (R) of 0.346 and weighted average of 97.7%. Similarly, the statistical analysis conducted on geographies consisting of 416,280,076 people shows a mild positive correlation between the proportion of Immigrants from Korea and percentage of population with at least kindergarten education in the United States with a correlation coefficient (R) of 0.308 and weighted average of 98.0%, a difference of 0.27%.
Kindergarten Correlation Summary
| Measurement | Subsaharan African | Immigrants from Korea |
| Minimum | 89.5% | 94.0% |
| Maximum | 100.0% | 100.0% |
| Range | 10.5% | 6.0% |
| Mean | 98.0% | 98.4% |
| Median | 97.9% | 98.5% |
| Interquartile 25% (IQ1) | 97.1% | 97.9% |
| Interquartile 75% (IQ3) | 100.0% | 99.5% |
| Interquartile Range (IQR) | 2.9% | 1.6% |
| Standard Deviation (Sample) | 2.0% | 1.3% |
| Standard Deviation (Population) | 2.0% | 1.3% |
Similar Demographics by Kindergarten
Demographics Similar to Sub-Saharan Africans by Kindergarten
In terms of kindergarten, the demographic groups most similar to Sub-Saharan Africans are Sudanese (97.7%, a difference of 0.0%), Immigrants from Costa Rica (97.7%, a difference of 0.0%), Sierra Leonean (97.7%, a difference of 0.0%), Senegalese (97.7%, a difference of 0.0%), and Iraqi (97.7%, a difference of 0.010%).
| Demographics | Rating | Rank | Kindergarten |
| Immigrants | Zaire | 4.5 /100 | #221 | Tragic 97.7% |
| Immigrants | Sudan | 4.5 /100 | #222 | Tragic 97.7% |
| Immigrants | Syria | 4.3 /100 | #223 | Tragic 97.7% |
| Iraqis | 3.9 /100 | #224 | Tragic 97.7% |
| Immigrants | Nepal | 3.8 /100 | #225 | Tragic 97.7% |
| Sudanese | 3.7 /100 | #226 | Tragic 97.7% |
| Immigrants | Costa Rica | 3.6 /100 | #227 | Tragic 97.7% |
| Sub-Saharan Africans | 3.5 /100 | #228 | Tragic 97.7% |
| Sierra Leoneans | 3.4 /100 | #229 | Tragic 97.7% |
| Senegalese | 3.3 /100 | #230 | Tragic 97.7% |
| Puerto Ricans | 2.7 /100 | #231 | Tragic 97.7% |
| Immigrants | Uruguay | 2.6 /100 | #232 | Tragic 97.7% |
| Immigrants | Pakistan | 2.2 /100 | #233 | Tragic 97.7% |
| Immigrants | Malaysia | 2.2 /100 | #234 | Tragic 97.7% |
| Colombians | 2.2 /100 | #235 | Tragic 97.7% |
Demographics Similar to Immigrants from Korea by Kindergarten
In terms of kindergarten, the demographic groups most similar to Immigrants from Korea are Immigrants from Spain (98.0%, a difference of 0.0%), Navajo (98.0%, a difference of 0.0%), Bermudan (98.0%, a difference of 0.0%), Immigrants from Jordan (98.0%, a difference of 0.0%), and Spanish American (98.0%, a difference of 0.010%).
| Demographics | Rating | Rank | Kindergarten |
| Immigrants | Italy | 58.9 /100 | #162 | Average 98.0% |
| Spanish Americans | 57.8 /100 | #163 | Average 98.0% |
| Immigrants | Micronesia | 57.7 /100 | #164 | Average 98.0% |
| Ugandans | 56.9 /100 | #165 | Average 98.0% |
| Chileans | 56.3 /100 | #166 | Average 98.0% |
| Immigrants | Spain | 54.6 /100 | #167 | Average 98.0% |
| Navajo | 54.4 /100 | #168 | Average 98.0% |
| Immigrants | Korea | 54.1 /100 | #169 | Average 98.0% |
| Bermudans | 54.0 /100 | #170 | Average 98.0% |
| Immigrants | Jordan | 54.0 /100 | #171 | Average 98.0% |
| Natives/Alaskans | 51.0 /100 | #172 | Average 98.0% |
| Kenyans | 51.0 /100 | #173 | Average 98.0% |
| Immigrants | Brazil | 50.0 /100 | #174 | Average 98.0% |
| Immigrants | Sri Lanka | 49.6 /100 | #175 | Average 97.9% |
| Albanians | 48.5 /100 | #176 | Average 97.9% |