Sri Lankan vs Yuman 8th Grade
COMPARE
Sri Lankan
Yuman
8th Grade
8th Grade Comparison
Sri Lankans
Yuman
94.0%
8TH GRADE
0.0/ 100
METRIC RATING
302nd/ 347
METRIC RANK
94.9%
8TH GRADE
0.4/ 100
METRIC RATING
265th/ 347
METRIC RANK
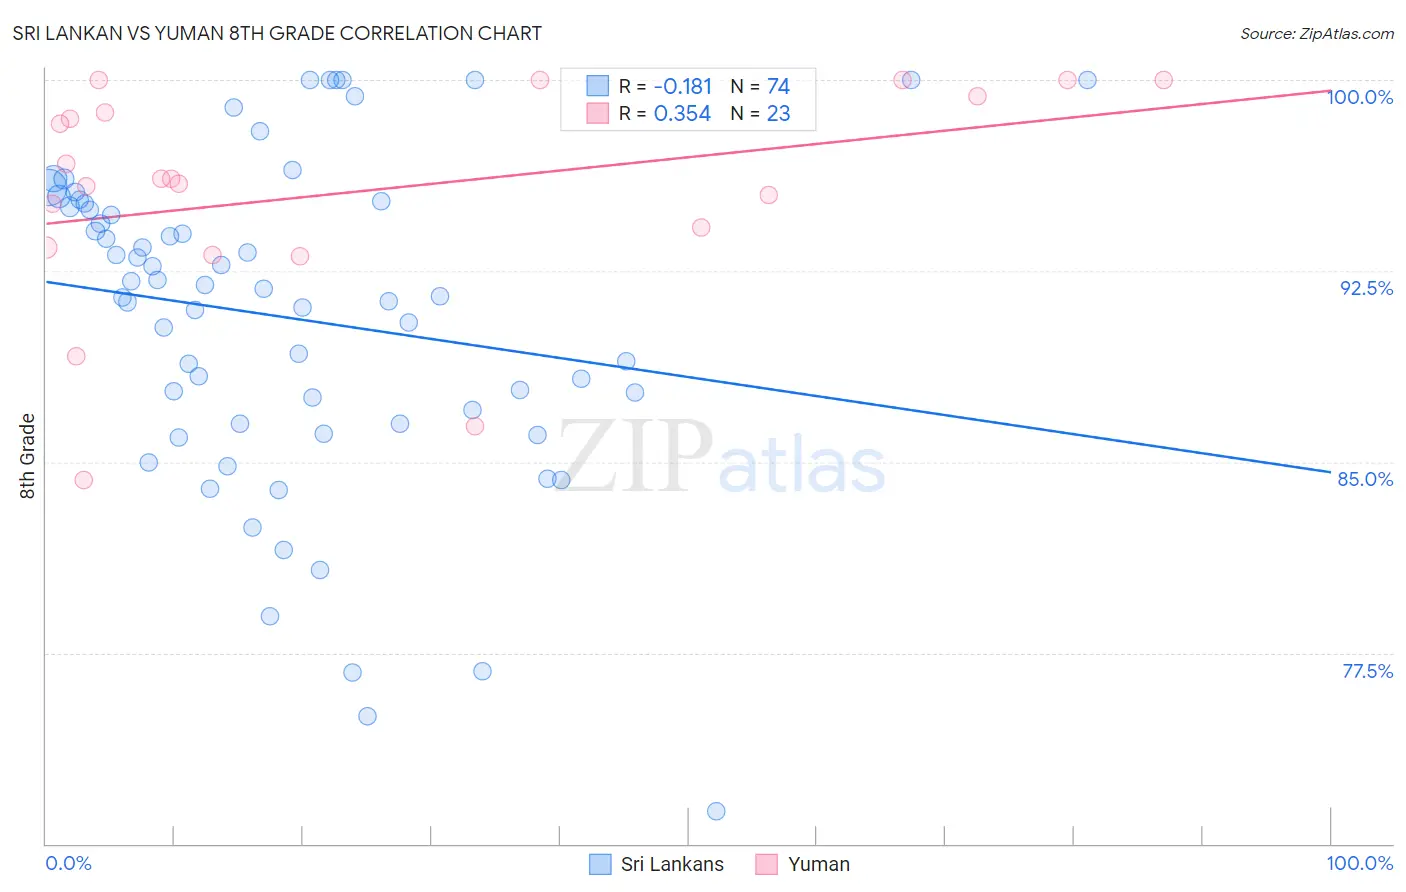
Sri Lankan vs Yuman 8th Grade Correlation Chart
The statistical analysis conducted on geographies consisting of 440,593,938 people shows a poor negative correlation between the proportion of Sri Lankans and percentage of population with at least 8th grade education in the United States with a correlation coefficient (R) of -0.181 and weighted average of 94.0%. Similarly, the statistical analysis conducted on geographies consisting of 40,696,349 people shows a mild positive correlation between the proportion of Yuman and percentage of population with at least 8th grade education in the United States with a correlation coefficient (R) of 0.354 and weighted average of 94.9%, a difference of 0.92%.
8th Grade Correlation Summary
| Measurement | Sri Lankan | Yuman |
| Minimum | 71.3% | 84.3% |
| Maximum | 100.0% | 100.0% |
| Range | 28.7% | 15.7% |
| Mean | 90.7% | 95.6% |
| Median | 91.7% | 96.1% |
| Interquartile 25% (IQ1) | 86.5% | 93.4% |
| Interquartile 75% (IQ3) | 95.2% | 99.3% |
| Interquartile Range (IQR) | 8.6% | 5.9% |
| Standard Deviation (Sample) | 6.4% | 4.3% |
| Standard Deviation (Population) | 6.4% | 4.2% |
Similar Demographics by 8th Grade
Demographics Similar to Sri Lankans by 8th Grade
In terms of 8th grade, the demographic groups most similar to Sri Lankans are Immigrants from Dominica (94.0%, a difference of 0.040%), Immigrants from Laos (94.1%, a difference of 0.10%), Cuban (94.1%, a difference of 0.12%), Immigrants from Burma/Myanmar (94.1%, a difference of 0.12%), and Guyanese (93.9%, a difference of 0.13%).
| Demographics | Rating | Rank | 8th Grade |
| Fijians | 0.0 /100 | #295 | Tragic 94.2% |
| Haitians | 0.0 /100 | #296 | Tragic 94.2% |
| Immigrants | South Eastern Asia | 0.0 /100 | #297 | Tragic 94.2% |
| Indonesians | 0.0 /100 | #298 | Tragic 94.1% |
| Cubans | 0.0 /100 | #299 | Tragic 94.1% |
| Immigrants | Burma/Myanmar | 0.0 /100 | #300 | Tragic 94.1% |
| Immigrants | Laos | 0.0 /100 | #301 | Tragic 94.1% |
| Sri Lankans | 0.0 /100 | #302 | Tragic 94.0% |
| Immigrants | Dominica | 0.0 /100 | #303 | Tragic 94.0% |
| Guyanese | 0.0 /100 | #304 | Tragic 93.9% |
| Immigrants | Haiti | 0.0 /100 | #305 | Tragic 93.9% |
| Immigrants | Guyana | 0.0 /100 | #306 | Tragic 93.8% |
| Immigrants | Portugal | 0.0 /100 | #307 | Tragic 93.8% |
| Ecuadorians | 0.0 /100 | #308 | Tragic 93.6% |
| Immigrants | Immigrants | 0.0 /100 | #309 | Tragic 93.6% |
Demographics Similar to Yuman by 8th Grade
In terms of 8th grade, the demographic groups most similar to Yuman are South American (94.9%, a difference of 0.0%), Immigrants from Nigeria (94.9%, a difference of 0.010%), Immigrants from Hong Kong (94.9%, a difference of 0.010%), Immigrants from Costa Rica (94.9%, a difference of 0.030%), and West Indian (94.8%, a difference of 0.040%).
| Demographics | Rating | Rank | 8th Grade |
| Immigrants | Congo | 0.6 /100 | #258 | Tragic 94.9% |
| Ghanaians | 0.6 /100 | #259 | Tragic 94.9% |
| Immigrants | Jamaica | 0.6 /100 | #260 | Tragic 94.9% |
| Immigrants | Costa Rica | 0.5 /100 | #261 | Tragic 94.9% |
| Immigrants | Nigeria | 0.4 /100 | #262 | Tragic 94.9% |
| Immigrants | Hong Kong | 0.4 /100 | #263 | Tragic 94.9% |
| South Americans | 0.4 /100 | #264 | Tragic 94.9% |
| Yuman | 0.4 /100 | #265 | Tragic 94.9% |
| West Indians | 0.3 /100 | #266 | Tragic 94.8% |
| Immigrants | Ghana | 0.3 /100 | #267 | Tragic 94.8% |
| Immigrants | Uruguay | 0.3 /100 | #268 | Tragic 94.8% |
| Immigrants | Thailand | 0.2 /100 | #269 | Tragic 94.8% |
| Immigrants | Uzbekistan | 0.2 /100 | #270 | Tragic 94.8% |
| Immigrants | Afghanistan | 0.2 /100 | #271 | Tragic 94.8% |
| Immigrants | South America | 0.2 /100 | #272 | Tragic 94.8% |