Sri Lankan vs Syrian 2nd Grade
COMPARE
Sri Lankan
Syrian
2nd Grade
2nd Grade Comparison
Sri Lankans
Syrians
96.8%
2ND GRADE
0.0/ 100
METRIC RATING
310th/ 347
METRIC RANK
98.1%
2ND GRADE
94.0/ 100
METRIC RATING
126th/ 347
METRIC RANK
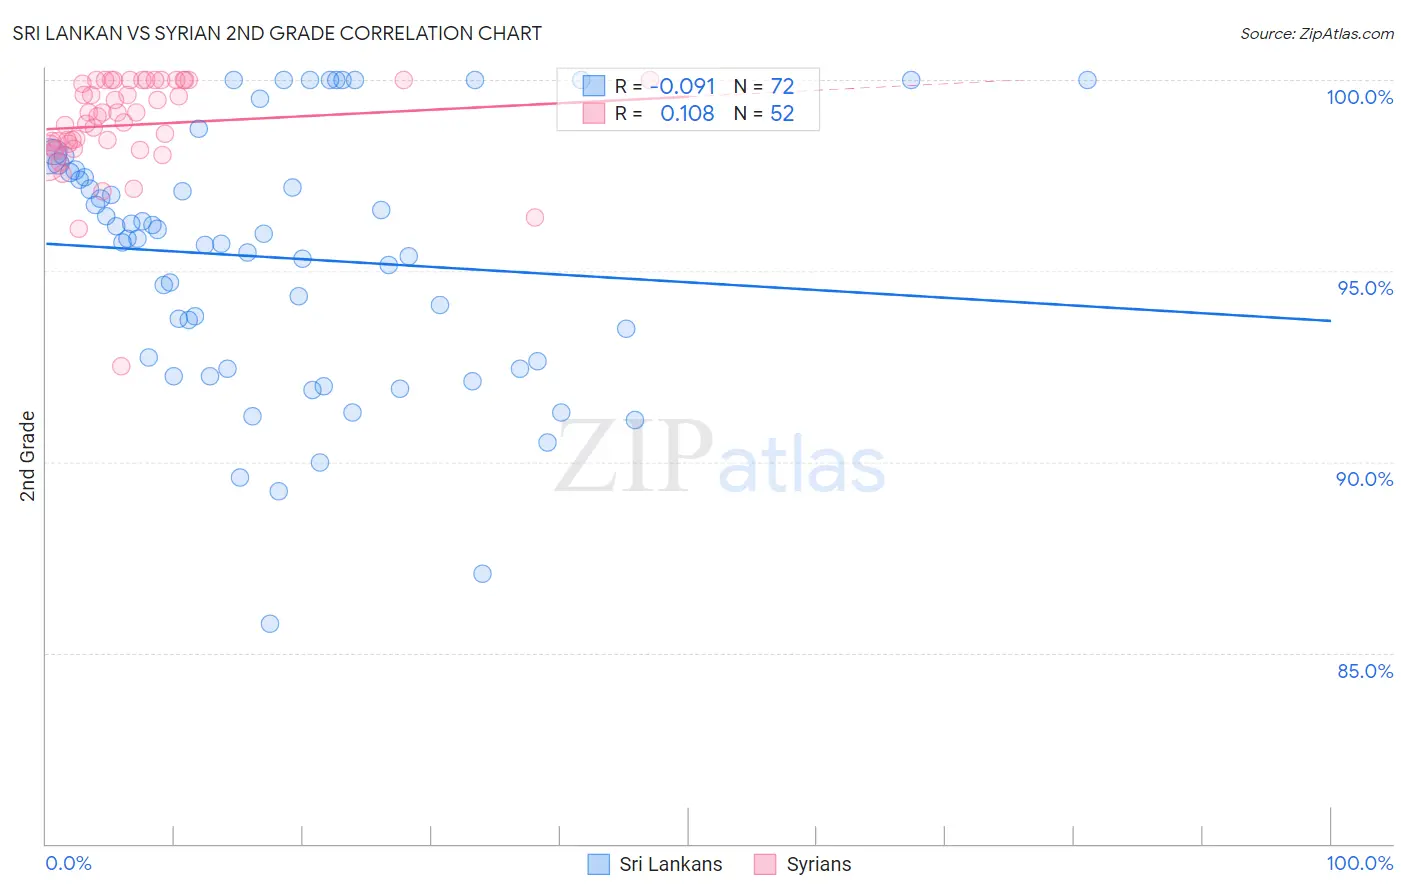
Sri Lankan vs Syrian 2nd Grade Correlation Chart
The statistical analysis conducted on geographies consisting of 440,593,746 people shows a slight negative correlation between the proportion of Sri Lankans and percentage of population with at least 2nd grade education in the United States with a correlation coefficient (R) of -0.091 and weighted average of 96.8%. Similarly, the statistical analysis conducted on geographies consisting of 266,305,988 people shows a poor positive correlation between the proportion of Syrians and percentage of population with at least 2nd grade education in the United States with a correlation coefficient (R) of 0.108 and weighted average of 98.1%, a difference of 1.3%.
2nd Grade Correlation Summary
| Measurement | Sri Lankan | Syrian |
| Minimum | 85.8% | 92.5% |
| Maximum | 100.0% | 100.0% |
| Range | 14.2% | 7.5% |
| Mean | 95.3% | 98.8% |
| Median | 95.8% | 99.1% |
| Interquartile 25% (IQ1) | 92.5% | 98.3% |
| Interquartile 75% (IQ3) | 97.6% | 100.0% |
| Interquartile Range (IQR) | 5.1% | 1.7% |
| Standard Deviation (Sample) | 3.4% | 1.3% |
| Standard Deviation (Population) | 3.3% | 1.3% |
Similar Demographics by 2nd Grade
Demographics Similar to Sri Lankans by 2nd Grade
In terms of 2nd grade, the demographic groups most similar to Sri Lankans are Belizean (96.8%, a difference of 0.0%), Immigrants from Haiti (96.8%, a difference of 0.010%), Guyanese (96.8%, a difference of 0.010%), Cape Verdean (96.8%, a difference of 0.010%), and Immigrants from the Azores (96.8%, a difference of 0.020%).
| Demographics | Rating | Rank | 2nd Grade |
| Ecuadorians | 0.0 /100 | #303 | Tragic 96.9% |
| Immigrants | Caribbean | 0.0 /100 | #304 | Tragic 96.9% |
| Nicaraguans | 0.0 /100 | #305 | Tragic 96.9% |
| Immigrants | Somalia | 0.0 /100 | #306 | Tragic 96.9% |
| Immigrants | Azores | 0.0 /100 | #307 | Tragic 96.8% |
| Immigrants | Haiti | 0.0 /100 | #308 | Tragic 96.8% |
| Belizeans | 0.0 /100 | #309 | Tragic 96.8% |
| Sri Lankans | 0.0 /100 | #310 | Tragic 96.8% |
| Guyanese | 0.0 /100 | #311 | Tragic 96.8% |
| Cape Verdeans | 0.0 /100 | #312 | Tragic 96.8% |
| Hispanics or Latinos | 0.0 /100 | #313 | Tragic 96.8% |
| Immigrants | Ecuador | 0.0 /100 | #314 | Tragic 96.8% |
| Immigrants | Belize | 0.0 /100 | #315 | Tragic 96.8% |
| Hondurans | 0.0 /100 | #316 | Tragic 96.7% |
| Immigrants | Laos | 0.0 /100 | #317 | Tragic 96.7% |
Demographics Similar to Syrians by 2nd Grade
In terms of 2nd grade, the demographic groups most similar to Syrians are Lebanese (98.1%, a difference of 0.0%), Immigrants from Japan (98.1%, a difference of 0.0%), Menominee (98.1%, a difference of 0.0%), Iroquois (98.1%, a difference of 0.0%), and Okinawan (98.1%, a difference of 0.010%).
| Demographics | Rating | Rank | 2nd Grade |
| Thais | 95.3 /100 | #119 | Exceptional 98.1% |
| Okinawans | 94.9 /100 | #120 | Exceptional 98.1% |
| Immigrants | Zimbabwe | 94.4 /100 | #121 | Exceptional 98.1% |
| Lebanese | 94.2 /100 | #122 | Exceptional 98.1% |
| Immigrants | Japan | 94.1 /100 | #123 | Exceptional 98.1% |
| Menominee | 94.1 /100 | #124 | Exceptional 98.1% |
| Iroquois | 94.1 /100 | #125 | Exceptional 98.1% |
| Syrians | 94.0 /100 | #126 | Exceptional 98.1% |
| Immigrants | Saudi Arabia | 93.6 /100 | #127 | Exceptional 98.1% |
| Immigrants | Serbia | 92.3 /100 | #128 | Exceptional 98.1% |
| Immigrants | Croatia | 92.1 /100 | #129 | Exceptional 98.1% |
| Seminole | 91.1 /100 | #130 | Exceptional 98.0% |
| Immigrants | Europe | 91.1 /100 | #131 | Exceptional 98.0% |
| Spaniards | 90.7 /100 | #132 | Exceptional 98.0% |
| Cambodians | 90.7 /100 | #133 | Exceptional 98.0% |