Sri Lankan vs Senegalese 1st Grade
COMPARE
Sri Lankan
Senegalese
1st Grade
1st Grade Comparison
Sri Lankans
Senegalese
96.9%
1ST GRADE
0.0/ 100
METRIC RATING
311th/ 347
METRIC RANK
97.7%
1ST GRADE
3.5/ 100
METRIC RATING
230th/ 347
METRIC RANK
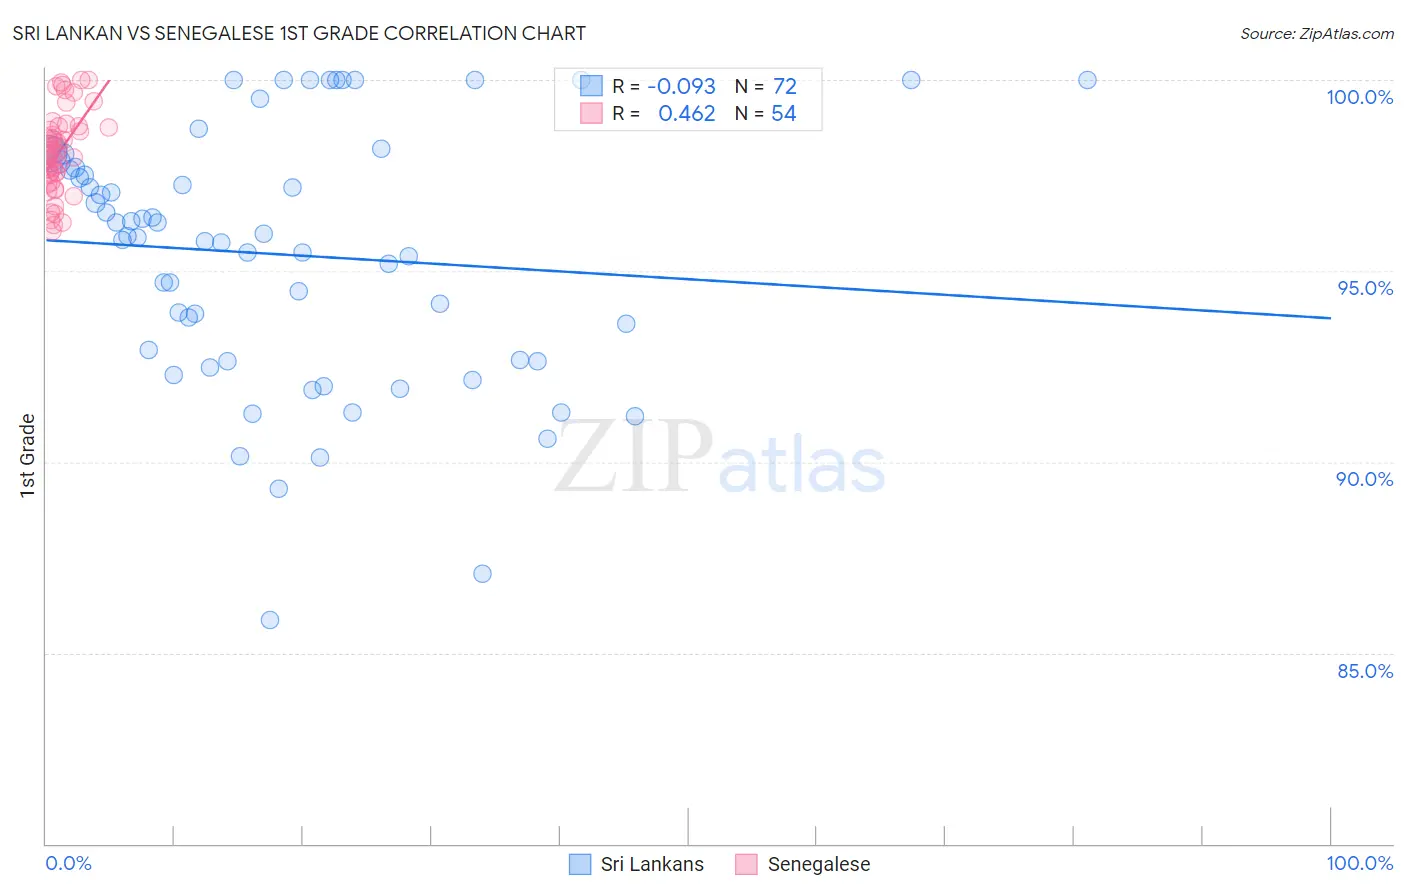
Sri Lankan vs Senegalese 1st Grade Correlation Chart
The statistical analysis conducted on geographies consisting of 440,593,746 people shows a slight negative correlation between the proportion of Sri Lankans and percentage of population with at least 1st grade education in the United States with a correlation coefficient (R) of -0.093 and weighted average of 96.9%. Similarly, the statistical analysis conducted on geographies consisting of 78,142,569 people shows a moderate positive correlation between the proportion of Senegalese and percentage of population with at least 1st grade education in the United States with a correlation coefficient (R) of 0.462 and weighted average of 97.7%, a difference of 0.79%.
1st Grade Correlation Summary
| Measurement | Sri Lankan | Senegalese |
| Minimum | 85.9% | 96.0% |
| Maximum | 100.0% | 100.0% |
| Range | 14.1% | 4.0% |
| Mean | 95.4% | 98.1% |
| Median | 95.9% | 98.1% |
| Interquartile 25% (IQ1) | 92.7% | 97.5% |
| Interquartile 75% (IQ3) | 97.8% | 98.7% |
| Interquartile Range (IQR) | 5.1% | 1.2% |
| Standard Deviation (Sample) | 3.3% | 1.0% |
| Standard Deviation (Population) | 3.3% | 1.0% |
Similar Demographics by 1st Grade
Demographics Similar to Sri Lankans by 1st Grade
In terms of 1st grade, the demographic groups most similar to Sri Lankans are Cape Verdean (96.9%, a difference of 0.0%), Guyanese (96.9%, a difference of 0.010%), Immigrants from the Azores (96.9%, a difference of 0.020%), Immigrants from Somalia (96.9%, a difference of 0.030%), and Hispanic or Latino (96.9%, a difference of 0.030%).
| Demographics | Rating | Rank | 1st Grade |
| Nicaraguans | 0.0 /100 | #304 | Tragic 97.0% |
| Ecuadorians | 0.0 /100 | #305 | Tragic 97.0% |
| Belizeans | 0.0 /100 | #306 | Tragic 96.9% |
| Immigrants | Somalia | 0.0 /100 | #307 | Tragic 96.9% |
| Hispanics or Latinos | 0.0 /100 | #308 | Tragic 96.9% |
| Immigrants | Haiti | 0.0 /100 | #309 | Tragic 96.9% |
| Immigrants | Azores | 0.0 /100 | #310 | Tragic 96.9% |
| Sri Lankans | 0.0 /100 | #311 | Tragic 96.9% |
| Cape Verdeans | 0.0 /100 | #312 | Tragic 96.9% |
| Guyanese | 0.0 /100 | #313 | Tragic 96.9% |
| Hondurans | 0.0 /100 | #314 | Tragic 96.9% |
| Immigrants | Belize | 0.0 /100 | #315 | Tragic 96.9% |
| Immigrants | Ecuador | 0.0 /100 | #316 | Tragic 96.9% |
| Immigrants | Nicaragua | 0.0 /100 | #317 | Tragic 96.9% |
| Immigrants | Laos | 0.0 /100 | #318 | Tragic 96.8% |
Demographics Similar to Senegalese by 1st Grade
In terms of 1st grade, the demographic groups most similar to Senegalese are Sierra Leonean (97.7%, a difference of 0.0%), Subsaharan African (97.7%, a difference of 0.0%), Immigrants from Costa Rica (97.7%, a difference of 0.0%), Immigrants from Zaire (97.7%, a difference of 0.010%), and Iraqi (97.7%, a difference of 0.010%).
| Demographics | Rating | Rank | 1st Grade |
| Immigrants | Zaire | 4.1 /100 | #223 | Tragic 97.7% |
| Iraqis | 4.0 /100 | #224 | Tragic 97.7% |
| Immigrants | Nepal | 4.0 /100 | #225 | Tragic 97.7% |
| Sudanese | 3.7 /100 | #226 | Tragic 97.7% |
| Sierra Leoneans | 3.6 /100 | #227 | Tragic 97.7% |
| Sub-Saharan Africans | 3.6 /100 | #228 | Tragic 97.7% |
| Immigrants | Costa Rica | 3.5 /100 | #229 | Tragic 97.7% |
| Senegalese | 3.5 /100 | #230 | Tragic 97.7% |
| Puerto Ricans | 3.0 /100 | #231 | Tragic 97.7% |
| Immigrants | Uruguay | 2.5 /100 | #232 | Tragic 97.6% |
| Immigrants | Pakistan | 2.2 /100 | #233 | Tragic 97.6% |
| Colombians | 2.2 /100 | #234 | Tragic 97.6% |
| Immigrants | Malaysia | 2.1 /100 | #235 | Tragic 97.6% |
| Immigrants | Western Asia | 2.1 /100 | #236 | Tragic 97.6% |
| U.S. Virgin Islanders | 1.9 /100 | #237 | Tragic 97.6% |