Spanish American vs Cree 5th Grade
COMPARE
Spanish American
Cree
5th Grade
5th Grade Comparison
Spanish Americans
Cree
97.3%
5TH GRADE
34.7/ 100
METRIC RATING
187th/ 347
METRIC RANK
97.7%
5TH GRADE
98.4/ 100
METRIC RATING
97th/ 347
METRIC RANK
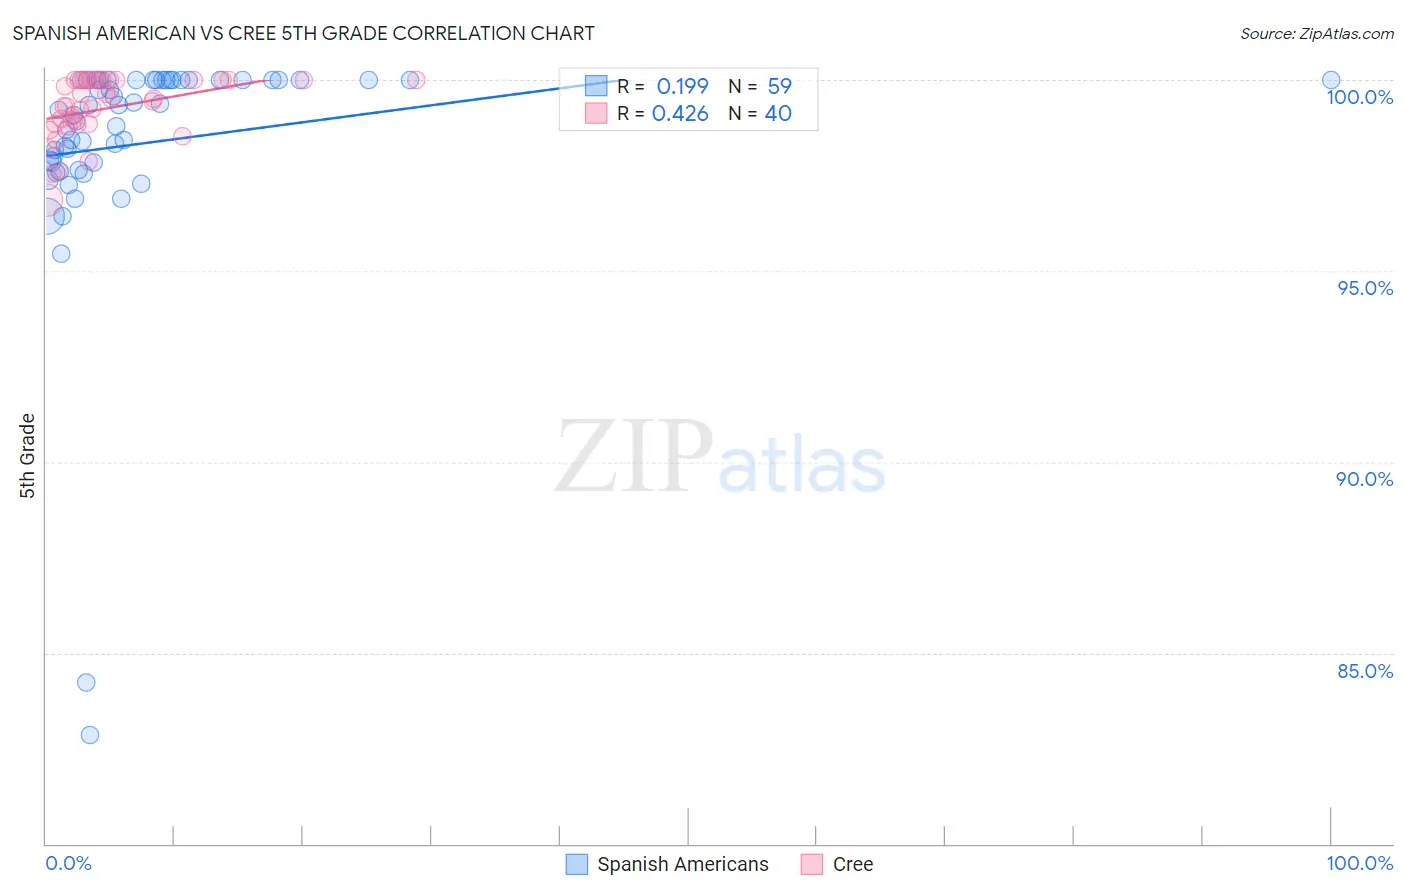
Spanish American vs Cree 5th Grade Correlation Chart
The statistical analysis conducted on geographies consisting of 103,168,542 people shows a poor positive correlation between the proportion of Spanish Americans and percentage of population with at least 5th grade education in the United States with a correlation coefficient (R) of 0.199 and weighted average of 97.3%. Similarly, the statistical analysis conducted on geographies consisting of 76,204,399 people shows a moderate positive correlation between the proportion of Cree and percentage of population with at least 5th grade education in the United States with a correlation coefficient (R) of 0.426 and weighted average of 97.7%, a difference of 0.50%.
5th Grade Correlation Summary
| Measurement | Spanish American | Cree |
| Minimum | 82.8% | 96.9% |
| Maximum | 100.0% | 100.0% |
| Range | 17.2% | 3.1% |
| Mean | 98.3% | 99.3% |
| Median | 99.2% | 99.5% |
| Interquartile 25% (IQ1) | 97.8% | 98.9% |
| Interquartile 75% (IQ3) | 100.0% | 100.0% |
| Interquartile Range (IQR) | 2.2% | 1.1% |
| Standard Deviation (Sample) | 3.0% | 0.81% |
| Standard Deviation (Population) | 3.0% | 0.80% |
Similar Demographics by 5th Grade
Demographics Similar to Spanish Americans by 5th Grade
In terms of 5th grade, the demographic groups most similar to Spanish Americans are Paraguayan (97.3%, a difference of 0.0%), Dutch West Indian (97.3%, a difference of 0.010%), Immigrants from Argentina (97.3%, a difference of 0.010%), Immigrants from Egypt (97.3%, a difference of 0.010%), and Black/African American (97.3%, a difference of 0.010%).
| Demographics | Rating | Rank | 5th Grade |
| Pakistanis | 40.2 /100 | #180 | Average 97.3% |
| Argentineans | 39.5 /100 | #181 | Fair 97.3% |
| Mongolians | 39.4 /100 | #182 | Fair 97.3% |
| Immigrants | Ukraine | 38.6 /100 | #183 | Fair 97.3% |
| Immigrants | Venezuela | 38.4 /100 | #184 | Fair 97.3% |
| Dutch West Indians | 36.2 /100 | #185 | Fair 97.3% |
| Immigrants | Argentina | 36.1 /100 | #186 | Fair 97.3% |
| Spanish Americans | 34.7 /100 | #187 | Fair 97.3% |
| Paraguayans | 33.7 /100 | #188 | Fair 97.3% |
| Immigrants | Egypt | 32.9 /100 | #189 | Fair 97.3% |
| Blacks/African Americans | 31.8 /100 | #190 | Fair 97.3% |
| Immigrants | Brazil | 31.5 /100 | #191 | Fair 97.3% |
| Panamanians | 31.3 /100 | #192 | Fair 97.3% |
| Navajo | 29.0 /100 | #193 | Fair 97.2% |
| Immigrants | Albania | 28.5 /100 | #194 | Fair 97.2% |
Demographics Similar to Cree by 5th Grade
In terms of 5th grade, the demographic groups most similar to Cree are Immigrants from Denmark (97.8%, a difference of 0.010%), Romanian (97.8%, a difference of 0.010%), Immigrants from Germany (97.8%, a difference of 0.010%), Yugoslavian (97.7%, a difference of 0.010%), and Turkish (97.7%, a difference of 0.010%).
| Demographics | Rating | Rank | 5th Grade |
| Immigrants | Ireland | 98.8 /100 | #90 | Exceptional 97.8% |
| Immigrants | Western Europe | 98.8 /100 | #91 | Exceptional 97.8% |
| Immigrants | Sweden | 98.7 /100 | #92 | Exceptional 97.8% |
| Delaware | 98.6 /100 | #93 | Exceptional 97.8% |
| Immigrants | Denmark | 98.6 /100 | #94 | Exceptional 97.8% |
| Romanians | 98.6 /100 | #95 | Exceptional 97.8% |
| Immigrants | Germany | 98.5 /100 | #96 | Exceptional 97.8% |
| Cree | 98.4 /100 | #97 | Exceptional 97.7% |
| Yugoslavians | 98.3 /100 | #98 | Exceptional 97.7% |
| Turks | 98.3 /100 | #99 | Exceptional 97.7% |
| Puget Sound Salish | 98.3 /100 | #100 | Exceptional 97.7% |
| South Africans | 98.3 /100 | #101 | Exceptional 97.7% |
| Choctaw | 98.0 /100 | #102 | Exceptional 97.7% |
| Cheyenne | 97.9 /100 | #103 | Exceptional 97.7% |
| German Russians | 97.8 /100 | #104 | Exceptional 97.7% |