Spanish American vs Afghan 3rd Grade
COMPARE
Spanish American
Afghan
3rd Grade
3rd Grade Comparison
Spanish Americans
Afghans
97.8%
3RD GRADE
51.8/ 100
METRIC RATING
172nd/ 347
METRIC RANK
97.1%
3RD GRADE
0.1/ 100
METRIC RATING
282nd/ 347
METRIC RANK
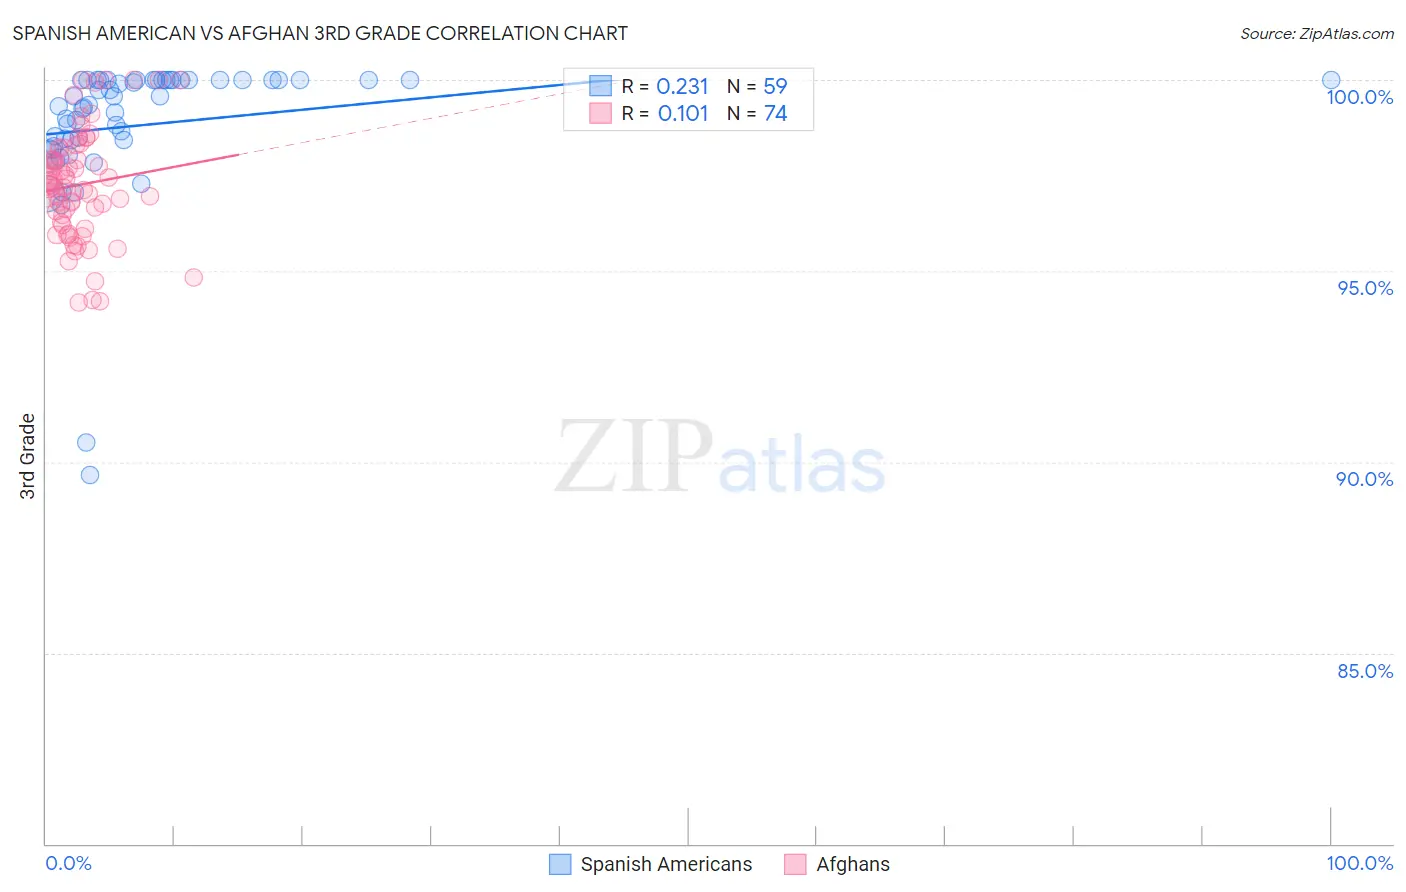
Spanish American vs Afghan 3rd Grade Correlation Chart
The statistical analysis conducted on geographies consisting of 103,168,542 people shows a weak positive correlation between the proportion of Spanish Americans and percentage of population with at least 3rd grade education in the United States with a correlation coefficient (R) of 0.231 and weighted average of 97.8%. Similarly, the statistical analysis conducted on geographies consisting of 148,851,685 people shows a poor positive correlation between the proportion of Afghans and percentage of population with at least 3rd grade education in the United States with a correlation coefficient (R) of 0.101 and weighted average of 97.1%, a difference of 0.64%.
3rd Grade Correlation Summary
| Measurement | Spanish American | Afghan |
| Minimum | 89.6% | 94.2% |
| Maximum | 100.0% | 100.0% |
| Range | 10.4% | 5.8% |
| Mean | 98.8% | 97.3% |
| Median | 99.3% | 97.3% |
| Interquartile 25% (IQ1) | 98.3% | 96.3% |
| Interquartile 75% (IQ3) | 100.0% | 98.2% |
| Interquartile Range (IQR) | 1.7% | 1.9% |
| Standard Deviation (Sample) | 1.9% | 1.4% |
| Standard Deviation (Population) | 1.9% | 1.4% |
Similar Demographics by 3rd Grade
Demographics Similar to Spanish Americans by 3rd Grade
In terms of 3rd grade, the demographic groups most similar to Spanish Americans are Kenyan (97.8%, a difference of 0.0%), Immigrants from Korea (97.8%, a difference of 0.0%), Ugandan (97.8%, a difference of 0.010%), Dutch West Indian (97.8%, a difference of 0.010%), and Chilean (97.8%, a difference of 0.010%).
| Demographics | Rating | Rank | 3rd Grade |
| Ugandans | 56.1 /100 | #165 | Average 97.8% |
| Dutch West Indians | 55.5 /100 | #166 | Average 97.8% |
| Chileans | 55.3 /100 | #167 | Average 97.8% |
| Immigrants | Spain | 54.3 /100 | #168 | Average 97.8% |
| Comanche | 53.8 /100 | #169 | Average 97.8% |
| Brazilians | 53.7 /100 | #170 | Average 97.8% |
| Kenyans | 51.8 /100 | #171 | Average 97.8% |
| Spanish Americans | 51.8 /100 | #172 | Average 97.8% |
| Immigrants | Korea | 50.9 /100 | #173 | Average 97.8% |
| Navajo | 50.0 /100 | #174 | Average 97.8% |
| Immigrants | Micronesia | 47.6 /100 | #175 | Average 97.8% |
| Immigrants | Poland | 47.1 /100 | #176 | Average 97.8% |
| Egyptians | 46.6 /100 | #177 | Average 97.7% |
| Immigrants | Brazil | 46.4 /100 | #178 | Average 97.7% |
| Immigrants | Belarus | 45.9 /100 | #179 | Average 97.7% |
Demographics Similar to Afghans by 3rd Grade
In terms of 3rd grade, the demographic groups most similar to Afghans are Houma (97.1%, a difference of 0.0%), Barbadian (97.2%, a difference of 0.010%), Immigrants from Philippines (97.2%, a difference of 0.020%), Immigrants from Ghana (97.2%, a difference of 0.020%), and Immigrants from Trinidad and Tobago (97.1%, a difference of 0.020%).
| Demographics | Rating | Rank | 3rd Grade |
| Immigrants | Uzbekistan | 0.1 /100 | #275 | Tragic 97.2% |
| Immigrants | Bolivia | 0.1 /100 | #276 | Tragic 97.2% |
| Trinidadians and Tobagonians | 0.1 /100 | #277 | Tragic 97.2% |
| Immigrants | Western Africa | 0.1 /100 | #278 | Tragic 97.2% |
| Immigrants | Philippines | 0.1 /100 | #279 | Tragic 97.2% |
| Immigrants | Ghana | 0.1 /100 | #280 | Tragic 97.2% |
| Barbadians | 0.1 /100 | #281 | Tragic 97.2% |
| Afghans | 0.1 /100 | #282 | Tragic 97.1% |
| Houma | 0.1 /100 | #283 | Tragic 97.1% |
| Immigrants | Trinidad and Tobago | 0.0 /100 | #284 | Tragic 97.1% |
| Immigrants | Hong Kong | 0.0 /100 | #285 | Tragic 97.1% |
| Immigrants | Barbados | 0.0 /100 | #286 | Tragic 97.1% |
| Immigrants | St. Vincent and the Grenadines | 0.0 /100 | #287 | Tragic 97.1% |
| Immigrants | West Indies | 0.0 /100 | #288 | Tragic 97.1% |
| Immigrants | Thailand | 0.0 /100 | #289 | Tragic 97.1% |