Spanish American Indian vs Cape Verdean High School Diploma
COMPARE
Spanish American Indian
Cape Verdean
High School Diploma
High School Diploma Comparison
Spanish American Indians
Cape Verdeans
79.8%
HIGH SCHOOL DIPLOMA
0.0/ 100
METRIC RATING
346th/ 347
METRIC RANK
85.1%
HIGH SCHOOL DIPLOMA
0.0/ 100
METRIC RATING
312th/ 347
METRIC RANK
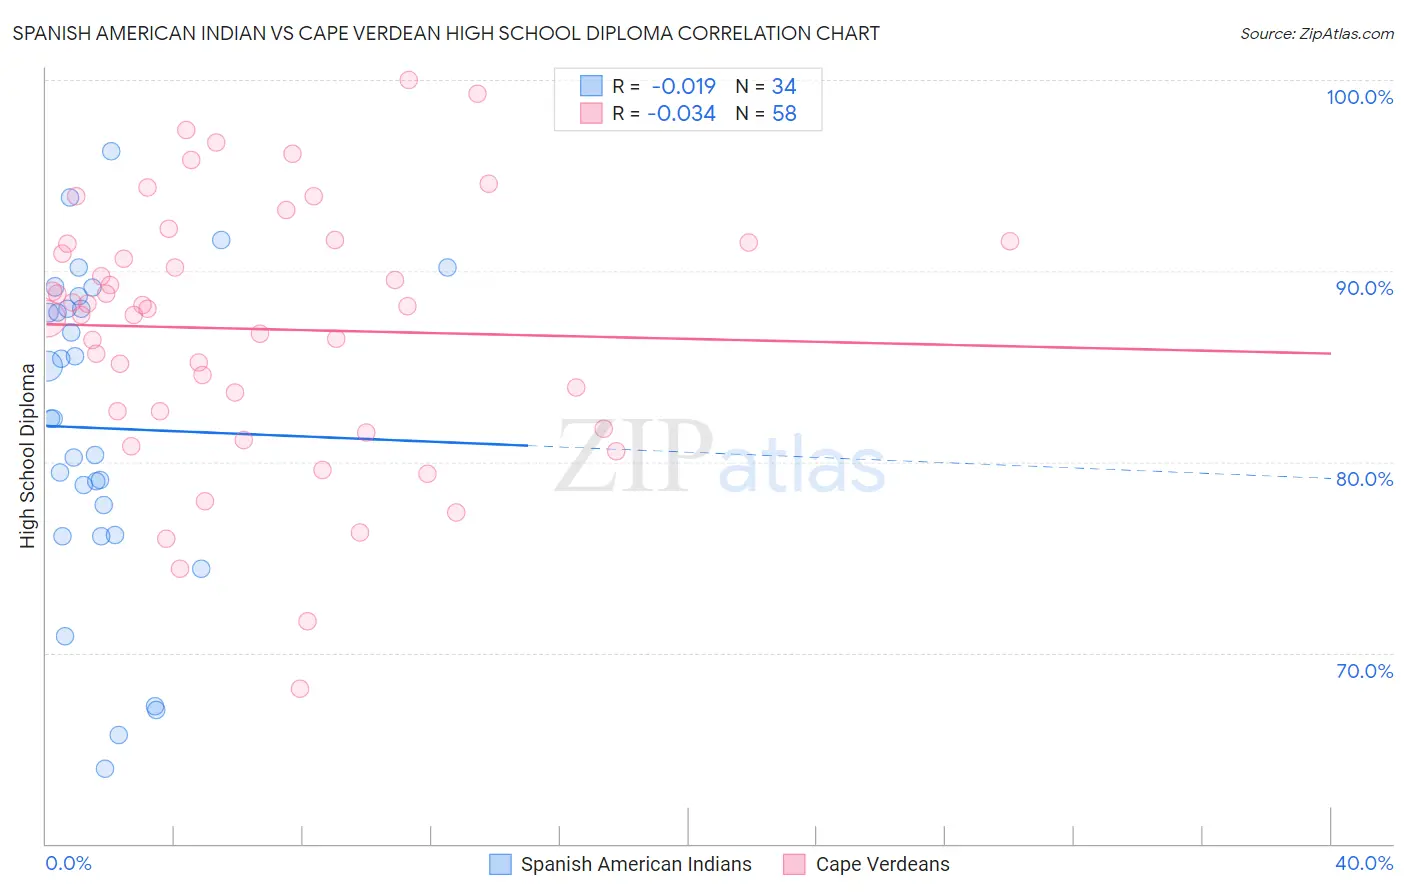
Spanish American Indian vs Cape Verdean High School Diploma Correlation Chart
The statistical analysis conducted on geographies consisting of 73,147,813 people shows no correlation between the proportion of Spanish American Indians and percentage of population with at least high school diploma education in the United States with a correlation coefficient (R) of -0.019 and weighted average of 79.8%. Similarly, the statistical analysis conducted on geographies consisting of 107,537,955 people shows no correlation between the proportion of Cape Verdeans and percentage of population with at least high school diploma education in the United States with a correlation coefficient (R) of -0.034 and weighted average of 85.1%, a difference of 6.6%.
High School Diploma Correlation Summary
| Measurement | Spanish American Indian | Cape Verdean |
| Minimum | 63.9% | 68.1% |
| Maximum | 96.3% | 100.0% |
| Range | 32.4% | 31.9% |
| Mean | 81.8% | 87.0% |
| Median | 82.3% | 88.1% |
| Interquartile 25% (IQ1) | 76.1% | 82.7% |
| Interquartile 75% (IQ3) | 88.0% | 91.5% |
| Interquartile Range (IQR) | 11.9% | 8.9% |
| Standard Deviation (Sample) | 8.3% | 6.8% |
| Standard Deviation (Population) | 8.2% | 6.7% |
Similar Demographics by High School Diploma
Demographics Similar to Spanish American Indians by High School Diploma
In terms of high school diploma, the demographic groups most similar to Spanish American Indians are Immigrants from Mexico (79.5%, a difference of 0.27%), Yakama (80.0%, a difference of 0.29%), Immigrants from Central America (80.1%, a difference of 0.44%), Immigrants from El Salvador (80.8%, a difference of 1.3%), and Immigrants from Guatemala (81.4%, a difference of 2.0%).
| Demographics | Rating | Rank | High School Diploma |
| Immigrants | Latin America | 0.0 /100 | #333 | Tragic 82.1% |
| Tohono O'odham | 0.0 /100 | #334 | Tragic 82.1% |
| Guatemalans | 0.0 /100 | #335 | Tragic 82.0% |
| Immigrants | Dominican Republic | 0.0 /100 | #336 | Tragic 82.0% |
| Immigrants | Yemen | 0.0 /100 | #337 | Tragic 81.8% |
| Salvadorans | 0.0 /100 | #338 | Tragic 81.7% |
| Pima | 0.0 /100 | #339 | Tragic 81.6% |
| Houma | 0.0 /100 | #340 | Tragic 81.5% |
| Mexicans | 0.0 /100 | #341 | Tragic 81.4% |
| Immigrants | Guatemala | 0.0 /100 | #342 | Tragic 81.4% |
| Immigrants | El Salvador | 0.0 /100 | #343 | Tragic 80.8% |
| Immigrants | Central America | 0.0 /100 | #344 | Tragic 80.1% |
| Yakama | 0.0 /100 | #345 | Tragic 80.0% |
| Spanish American Indians | 0.0 /100 | #346 | Tragic 79.8% |
| Immigrants | Mexico | 0.0 /100 | #347 | Tragic 79.5% |
Demographics Similar to Cape Verdeans by High School Diploma
In terms of high school diploma, the demographic groups most similar to Cape Verdeans are Ecuadorian (85.1%, a difference of 0.050%), Apache (85.1%, a difference of 0.060%), Immigrants from Dominica (85.2%, a difference of 0.14%), Immigrants from Armenia (85.2%, a difference of 0.15%), and Navajo (85.2%, a difference of 0.16%).
| Demographics | Rating | Rank | High School Diploma |
| Immigrants | Portugal | 0.0 /100 | #305 | Tragic 85.3% |
| Immigrants | Guyana | 0.0 /100 | #306 | Tragic 85.3% |
| Navajo | 0.0 /100 | #307 | Tragic 85.2% |
| Immigrants | Armenia | 0.0 /100 | #308 | Tragic 85.2% |
| Immigrants | Dominica | 0.0 /100 | #309 | Tragic 85.2% |
| Apache | 0.0 /100 | #310 | Tragic 85.1% |
| Ecuadorians | 0.0 /100 | #311 | Tragic 85.1% |
| Cape Verdeans | 0.0 /100 | #312 | Tragic 85.1% |
| Immigrants | Ecuador | 0.0 /100 | #313 | Tragic 84.8% |
| Yaqui | 0.0 /100 | #314 | Tragic 84.7% |
| Puerto Ricans | 0.0 /100 | #315 | Tragic 84.7% |
| Belizeans | 0.0 /100 | #316 | Tragic 84.3% |
| Immigrants | Caribbean | 0.0 /100 | #317 | Tragic 84.3% |
| Immigrants | Belize | 0.0 /100 | #318 | Tragic 84.2% |
| Central American Indians | 0.0 /100 | #319 | Tragic 84.2% |