Spaniard vs Chickasaw College, 1 year or more
COMPARE
Spaniard
Chickasaw
College, 1 year or more
College, 1 year or more Comparison
Spaniards
Chickasaw
59.0%
COLLEGE, 1 YEAR OR MORE
38.3/ 100
METRIC RATING
184th/ 347
METRIC RANK
53.3%
COLLEGE, 1 YEAR OR MORE
0.0/ 100
METRIC RATING
292nd/ 347
METRIC RANK
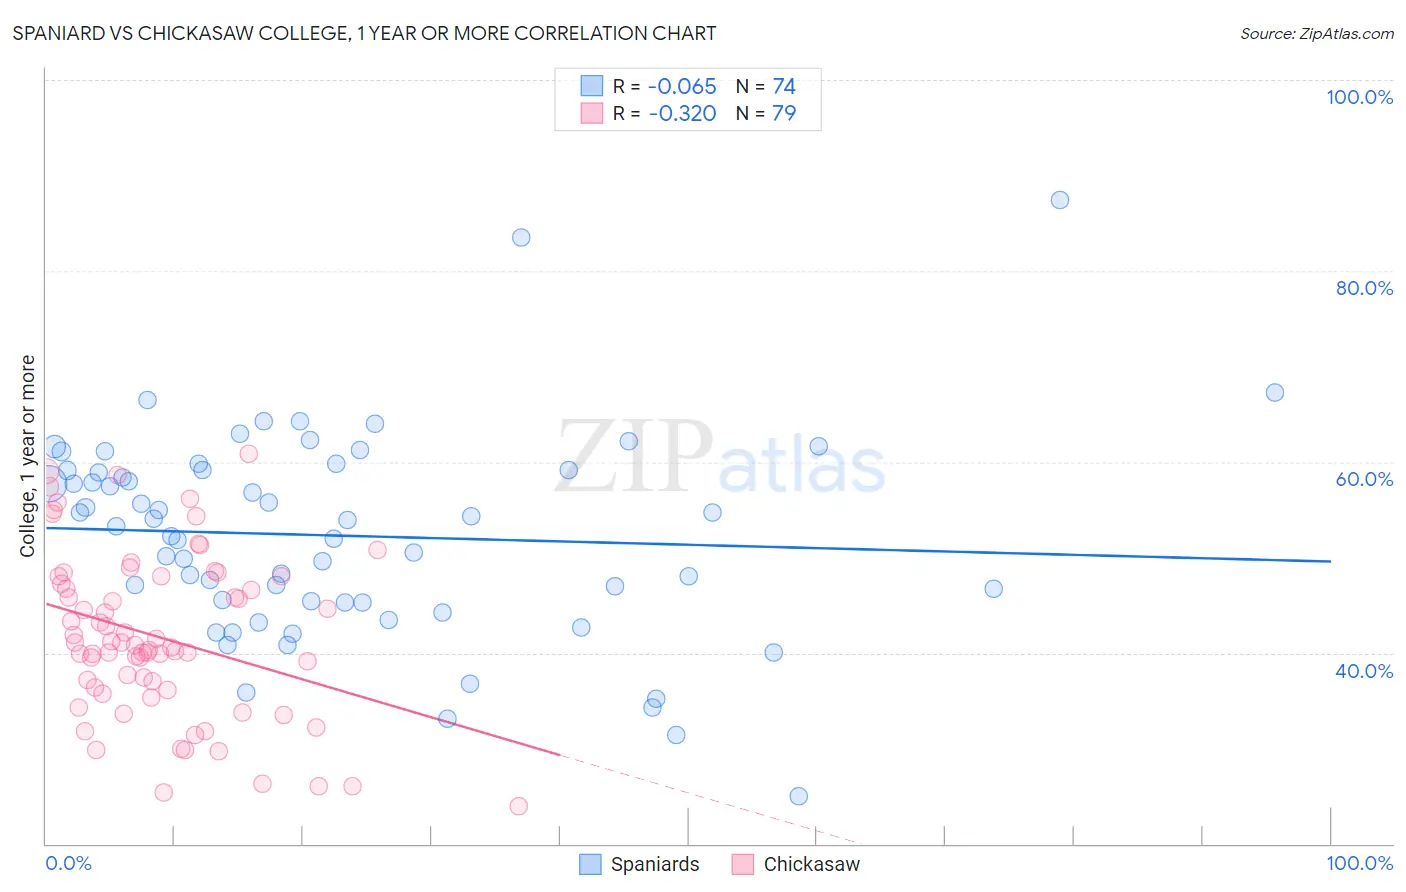
Spaniard vs Chickasaw College, 1 year or more Correlation Chart
The statistical analysis conducted on geographies consisting of 443,541,237 people shows a slight negative correlation between the proportion of Spaniards and percentage of population with at least college, 1 year or more education in the United States with a correlation coefficient (R) of -0.065 and weighted average of 59.0%. Similarly, the statistical analysis conducted on geographies consisting of 147,726,303 people shows a mild negative correlation between the proportion of Chickasaw and percentage of population with at least college, 1 year or more education in the United States with a correlation coefficient (R) of -0.320 and weighted average of 53.3%, a difference of 10.7%.
College, 1 year or more Correlation Summary
| Measurement | Spaniard | Chickasaw |
| Minimum | 25.0% | 23.9% |
| Maximum | 87.4% | 60.9% |
| Range | 62.4% | 37.0% |
| Mean | 52.3% | 41.6% |
| Median | 53.6% | 40.8% |
| Interquartile 25% (IQ1) | 45.3% | 36.2% |
| Interquartile 75% (IQ3) | 59.1% | 48.0% |
| Interquartile Range (IQR) | 13.8% | 11.8% |
| Standard Deviation (Sample) | 10.8% | 8.6% |
| Standard Deviation (Population) | 10.7% | 8.5% |
Similar Demographics by College, 1 year or more
Demographics Similar to Spaniards by College, 1 year or more
In terms of college, 1 year or more, the demographic groups most similar to Spaniards are German Russian (59.1%, a difference of 0.060%), South American (59.0%, a difference of 0.14%), Scotch-Irish (58.9%, a difference of 0.21%), German (58.9%, a difference of 0.21%), and French (58.9%, a difference of 0.23%).
| Demographics | Rating | Rank | College, 1 year or more |
| Tlingit-Haida | 48.4 /100 | #177 | Average 59.4% |
| Czechoslovakians | 48.3 /100 | #178 | Average 59.4% |
| Bermudans | 46.6 /100 | #179 | Average 59.3% |
| Yugoslavians | 44.1 /100 | #180 | Average 59.2% |
| Swiss | 43.4 /100 | #181 | Average 59.2% |
| Immigrants | Bosnia and Herzegovina | 42.8 /100 | #182 | Average 59.2% |
| German Russians | 39.3 /100 | #183 | Fair 59.1% |
| Spaniards | 38.3 /100 | #184 | Fair 59.0% |
| South Americans | 35.9 /100 | #185 | Fair 59.0% |
| Scotch-Irish | 34.7 /100 | #186 | Fair 58.9% |
| Germans | 34.7 /100 | #187 | Fair 58.9% |
| French | 34.4 /100 | #188 | Fair 58.9% |
| Uruguayans | 31.8 /100 | #189 | Fair 58.8% |
| Immigrants | Cameroon | 31.2 /100 | #190 | Fair 58.8% |
| Immigrants | Philippines | 29.2 /100 | #191 | Fair 58.7% |
Demographics Similar to Chickasaw by College, 1 year or more
In terms of college, 1 year or more, the demographic groups most similar to Chickasaw are Black/African American (53.3%, a difference of 0.020%), Cuban (53.4%, a difference of 0.13%), Alaskan Athabascan (53.4%, a difference of 0.18%), Alaska Native (53.4%, a difference of 0.20%), and Immigrants from Ecuador (53.4%, a difference of 0.20%).
| Demographics | Rating | Rank | College, 1 year or more |
| Immigrants | Guyana | 0.1 /100 | #285 | Tragic 53.5% |
| Central American Indians | 0.1 /100 | #286 | Tragic 53.5% |
| Immigrants | Belize | 0.1 /100 | #287 | Tragic 53.5% |
| Alaska Natives | 0.0 /100 | #288 | Tragic 53.4% |
| Immigrants | Ecuador | 0.0 /100 | #289 | Tragic 53.4% |
| Alaskan Athabascans | 0.0 /100 | #290 | Tragic 53.4% |
| Cubans | 0.0 /100 | #291 | Tragic 53.4% |
| Chickasaw | 0.0 /100 | #292 | Tragic 53.3% |
| Blacks/African Americans | 0.0 /100 | #293 | Tragic 53.3% |
| Cherokee | 0.0 /100 | #294 | Tragic 53.2% |
| Yaqui | 0.0 /100 | #295 | Tragic 53.2% |
| Sioux | 0.0 /100 | #296 | Tragic 53.0% |
| Paiute | 0.0 /100 | #297 | Tragic 52.9% |
| Immigrants | Dominica | 0.0 /100 | #298 | Tragic 52.5% |
| Immigrants | Nicaragua | 0.0 /100 | #299 | Tragic 52.4% |