Soviet Union vs Slavic Kindergarten
COMPARE
Soviet Union
Slavic
Kindergarten
Kindergarten Comparison
Soviet Union
Slavs
98.0%
KINDERGARTEN
70.8/ 100
METRIC RATING
151st/ 347
METRIC RANK
98.4%
KINDERGARTEN
99.7/ 100
METRIC RATING
61st/ 347
METRIC RANK
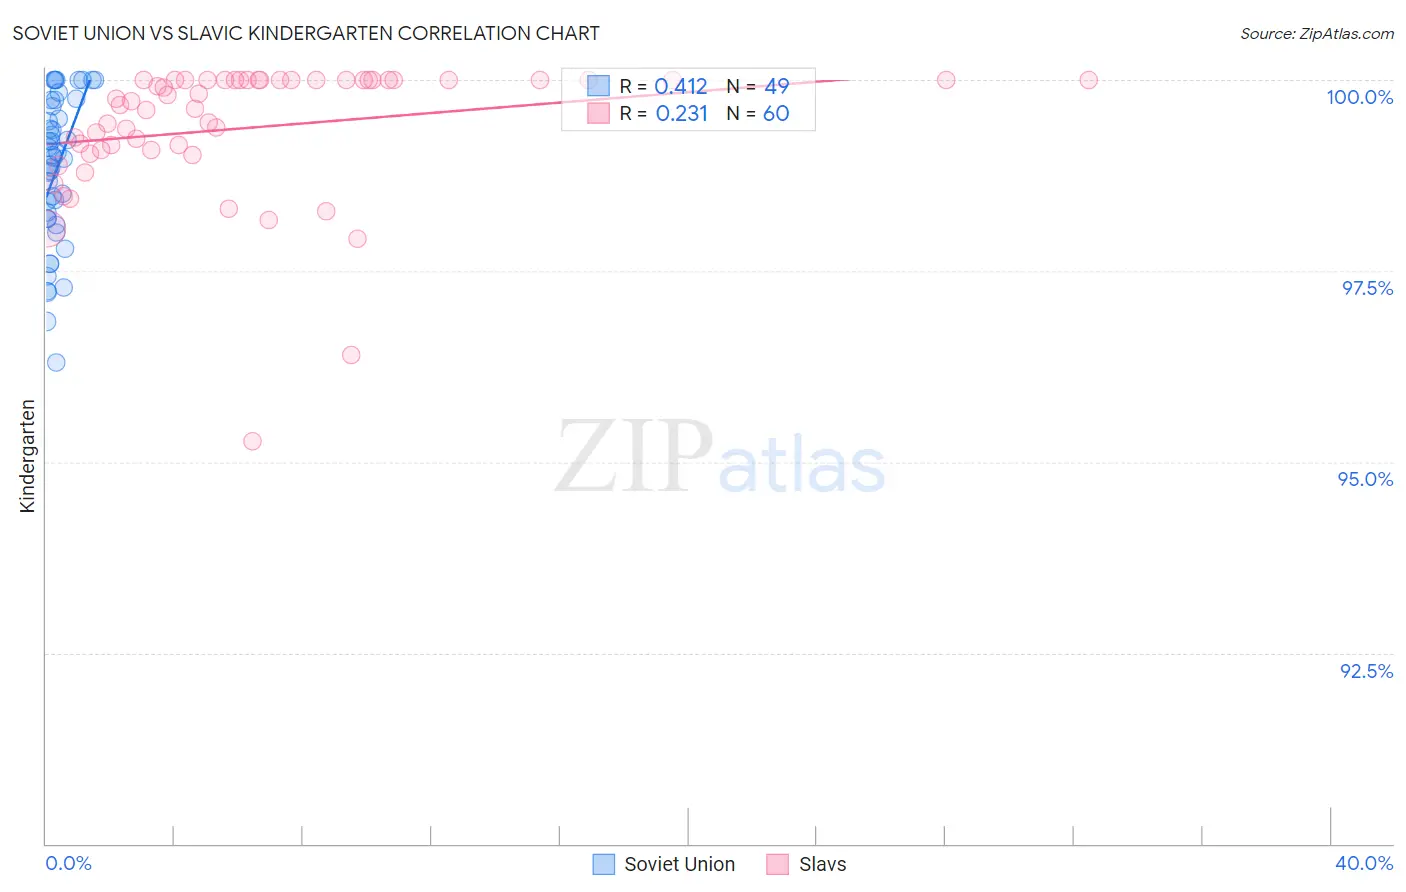
Soviet Union vs Slavic Kindergarten Correlation Chart
The statistical analysis conducted on geographies consisting of 43,454,395 people shows a moderate positive correlation between the proportion of Soviet Union and percentage of population with at least kindergarten education in the United States with a correlation coefficient (R) of 0.412 and weighted average of 98.0%. Similarly, the statistical analysis conducted on geographies consisting of 270,869,056 people shows a weak positive correlation between the proportion of Slavs and percentage of population with at least kindergarten education in the United States with a correlation coefficient (R) of 0.231 and weighted average of 98.4%, a difference of 0.39%.
Kindergarten Correlation Summary
| Measurement | Soviet Union | Slavic |
| Minimum | 96.3% | 95.3% |
| Maximum | 100.0% | 100.0% |
| Range | 3.7% | 4.7% |
| Mean | 98.8% | 99.4% |
| Median | 99.0% | 99.7% |
| Interquartile 25% (IQ1) | 98.2% | 99.1% |
| Interquartile 75% (IQ3) | 99.7% | 100.0% |
| Interquartile Range (IQR) | 1.5% | 0.92% |
| Standard Deviation (Sample) | 0.96% | 0.90% |
| Standard Deviation (Population) | 0.95% | 0.89% |
Similar Demographics by Kindergarten
Demographics Similar to Soviet Union by Kindergarten
In terms of kindergarten, the demographic groups most similar to Soviet Union are Dutch West Indian (98.0%, a difference of 0.0%), Jordanian (98.0%, a difference of 0.010%), Immigrants from Moldova (98.0%, a difference of 0.010%), Immigrants from Iran (98.0%, a difference of 0.010%), and Comanche (98.0%, a difference of 0.010%).
| Demographics | Rating | Rank | Kindergarten |
| Alsatians | 80.4 /100 | #144 | Excellent 98.1% |
| Hmong | 78.8 /100 | #145 | Good 98.1% |
| Filipinos | 78.3 /100 | #146 | Good 98.0% |
| Immigrants | Israel | 77.6 /100 | #147 | Good 98.0% |
| Apache | 75.0 /100 | #148 | Good 98.0% |
| Immigrants | Greece | 74.9 /100 | #149 | Good 98.0% |
| Jordanians | 72.8 /100 | #150 | Good 98.0% |
| Soviet Union | 70.8 /100 | #151 | Good 98.0% |
| Dutch West Indians | 70.1 /100 | #152 | Good 98.0% |
| Immigrants | Moldova | 69.1 /100 | #153 | Good 98.0% |
| Immigrants | Iran | 68.8 /100 | #154 | Good 98.0% |
| Comanche | 68.3 /100 | #155 | Good 98.0% |
| Immigrants | South Central Asia | 66.6 /100 | #156 | Good 98.0% |
| Immigrants | North Macedonia | 66.4 /100 | #157 | Good 98.0% |
| Venezuelans | 64.7 /100 | #158 | Good 98.0% |
Demographics Similar to Slavs by Kindergarten
In terms of kindergarten, the demographic groups most similar to Slavs are Immigrants from Canada (98.4%, a difference of 0.0%), Creek (98.4%, a difference of 0.0%), New Zealander (98.4%, a difference of 0.0%), Immigrants from North America (98.4%, a difference of 0.0%), and Greek (98.4%, a difference of 0.0%).
| Demographics | Rating | Rank | Kindergarten |
| Pueblo | 99.8 /100 | #54 | Exceptional 98.4% |
| Immigrants | Scotland | 99.8 /100 | #55 | Exceptional 98.4% |
| Americans | 99.8 /100 | #56 | Exceptional 98.4% |
| Austrians | 99.8 /100 | #57 | Exceptional 98.4% |
| Bulgarians | 99.7 /100 | #58 | Exceptional 98.4% |
| Immigrants | Canada | 99.7 /100 | #59 | Exceptional 98.4% |
| Creek | 99.7 /100 | #60 | Exceptional 98.4% |
| Slavs | 99.7 /100 | #61 | Exceptional 98.4% |
| New Zealanders | 99.7 /100 | #62 | Exceptional 98.4% |
| Immigrants | North America | 99.7 /100 | #63 | Exceptional 98.4% |
| Greeks | 99.7 /100 | #64 | Exceptional 98.4% |
| Maltese | 99.7 /100 | #65 | Exceptional 98.4% |
| Cheyenne | 99.6 /100 | #66 | Exceptional 98.4% |
| Canadians | 99.6 /100 | #67 | Exceptional 98.4% |
| Immigrants | Northern Europe | 99.6 /100 | #68 | Exceptional 98.4% |