Soviet Union vs Immigrants from Moldova 12th Grade, No Diploma
COMPARE
Soviet Union
Immigrants from Moldova
12th Grade, No Diploma
12th Grade, No Diploma Comparison
Soviet Union
Immigrants from Moldova
92.7%
12TH GRADE, NO DIPLOMA
99.6/ 100
METRIC RATING
66th/ 347
METRIC RANK
92.6%
12TH GRADE, NO DIPLOMA
99.4/ 100
METRIC RATING
74th/ 347
METRIC RANK
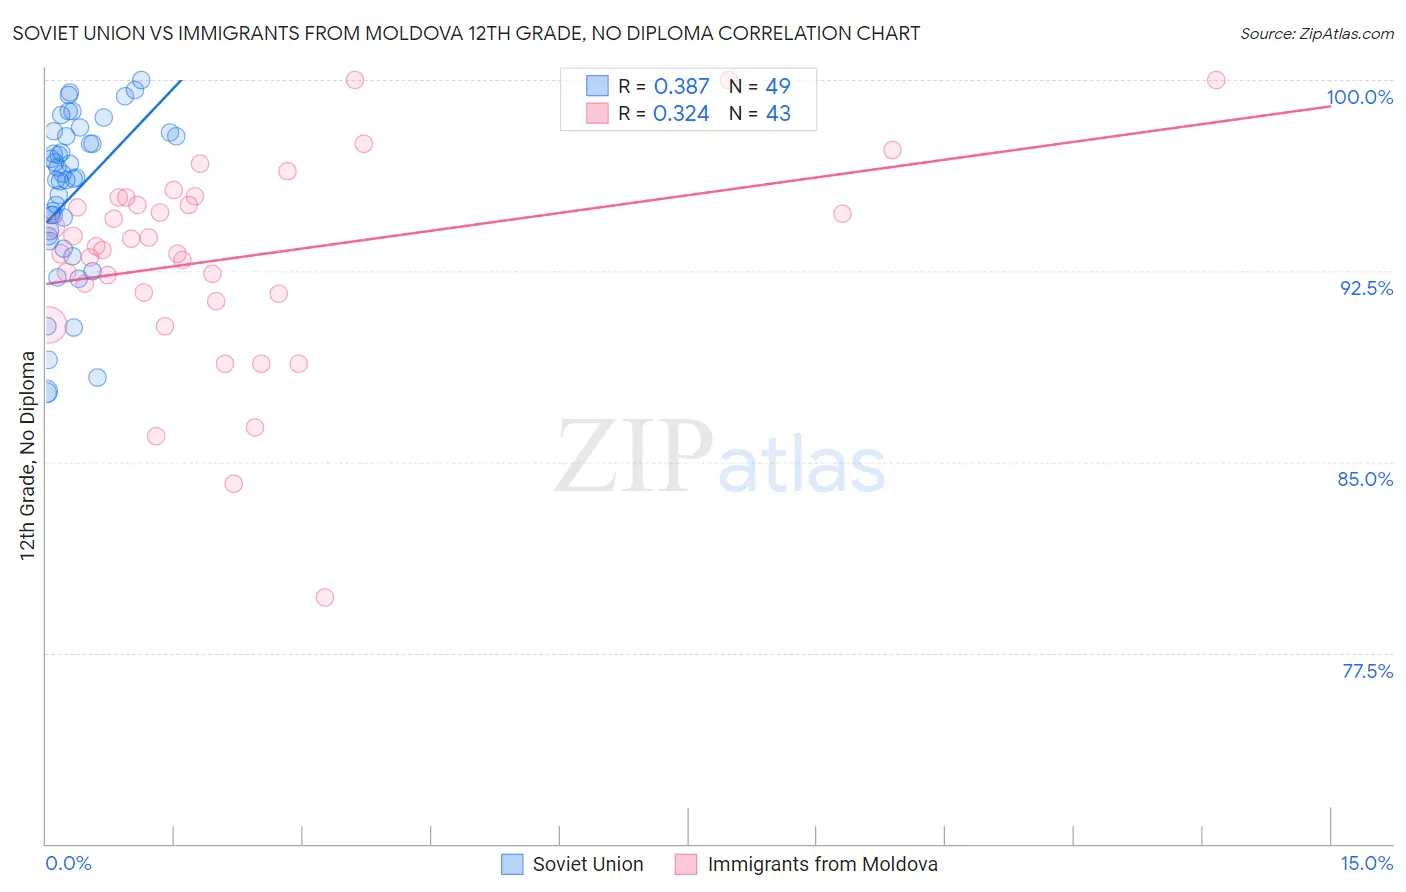
Soviet Union vs Immigrants from Moldova 12th Grade, No Diploma Correlation Chart
The statistical analysis conducted on geographies consisting of 43,454,395 people shows a mild positive correlation between the proportion of Soviet Union and percentage of population with at least 12th grade (no diploma) education in the United States with a correlation coefficient (R) of 0.387 and weighted average of 92.7%. Similarly, the statistical analysis conducted on geographies consisting of 124,398,501 people shows a mild positive correlation between the proportion of Immigrants from Moldova and percentage of population with at least 12th grade (no diploma) education in the United States with a correlation coefficient (R) of 0.324 and weighted average of 92.6%, a difference of 0.090%.
12th Grade, No Diploma Correlation Summary
| Measurement | Soviet Union | Immigrants from Moldova |
| Minimum | 87.7% | 79.7% |
| Maximum | 100.0% | 100.0% |
| Range | 12.3% | 20.3% |
| Mean | 95.5% | 93.0% |
| Median | 96.2% | 93.5% |
| Interquartile 25% (IQ1) | 93.8% | 91.6% |
| Interquartile 75% (IQ3) | 97.9% | 95.4% |
| Interquartile Range (IQR) | 4.1% | 3.8% |
| Standard Deviation (Sample) | 3.2% | 4.0% |
| Standard Deviation (Population) | 3.2% | 4.0% |
Demographics Similar to Soviet Union and Immigrants from Moldova by 12th Grade, No Diploma
In terms of 12th grade, no diploma, the demographic groups most similar to Soviet Union are Zimbabwean (92.7%, a difference of 0.030%), Immigrants from Netherlands (92.7%, a difference of 0.030%), Austrian (92.7%, a difference of 0.030%), Immigrants from South Africa (92.7%, a difference of 0.040%), and Immigrants from Czechoslovakia (92.7%, a difference of 0.040%). Similarly, the demographic groups most similar to Immigrants from Moldova are Burmese (92.6%, a difference of 0.0%), Native Hawaiian (92.6%, a difference of 0.0%), French (92.6%, a difference of 0.0%), Immigrants from South Central Asia (92.6%, a difference of 0.020%), and Immigrants from England (92.6%, a difference of 0.020%).
| Demographics | Rating | Rank | 12th Grade, No Diploma |
| Slavs | 99.7 /100 | #60 | Exceptional 92.8% |
| Immigrants | Japan | 99.7 /100 | #61 | Exceptional 92.8% |
| Ukrainians | 99.6 /100 | #62 | Exceptional 92.7% |
| Zimbabweans | 99.6 /100 | #63 | Exceptional 92.7% |
| Immigrants | Netherlands | 99.6 /100 | #64 | Exceptional 92.7% |
| Austrians | 99.6 /100 | #65 | Exceptional 92.7% |
| Soviet Union | 99.6 /100 | #66 | Exceptional 92.7% |
| Immigrants | South Africa | 99.5 /100 | #67 | Exceptional 92.7% |
| Immigrants | Czechoslovakia | 99.5 /100 | #68 | Exceptional 92.7% |
| Immigrants | Iran | 99.5 /100 | #69 | Exceptional 92.7% |
| Czechoslovakians | 99.5 /100 | #70 | Exceptional 92.6% |
| Immigrants | Latvia | 99.5 /100 | #71 | Exceptional 92.6% |
| Immigrants | South Central Asia | 99.5 /100 | #72 | Exceptional 92.6% |
| Burmese | 99.4 /100 | #73 | Exceptional 92.6% |
| Immigrants | Moldova | 99.4 /100 | #74 | Exceptional 92.6% |
| Native Hawaiians | 99.4 /100 | #75 | Exceptional 92.6% |
| French | 99.4 /100 | #76 | Exceptional 92.6% |
| Immigrants | England | 99.4 /100 | #77 | Exceptional 92.6% |
| Cambodians | 99.3 /100 | #78 | Exceptional 92.6% |
| Romanians | 99.3 /100 | #79 | Exceptional 92.6% |
| French Canadians | 99.3 /100 | #80 | Exceptional 92.6% |