South American vs Norwegian 6th Grade
COMPARE
South American
Norwegian
6th Grade
6th Grade Comparison
South Americans
Norwegians
96.4%
6TH GRADE
0.4/ 100
METRIC RATING
259th/ 347
METRIC RANK
98.3%
6TH GRADE
100.0/ 100
METRIC RATING
6th/ 347
METRIC RANK
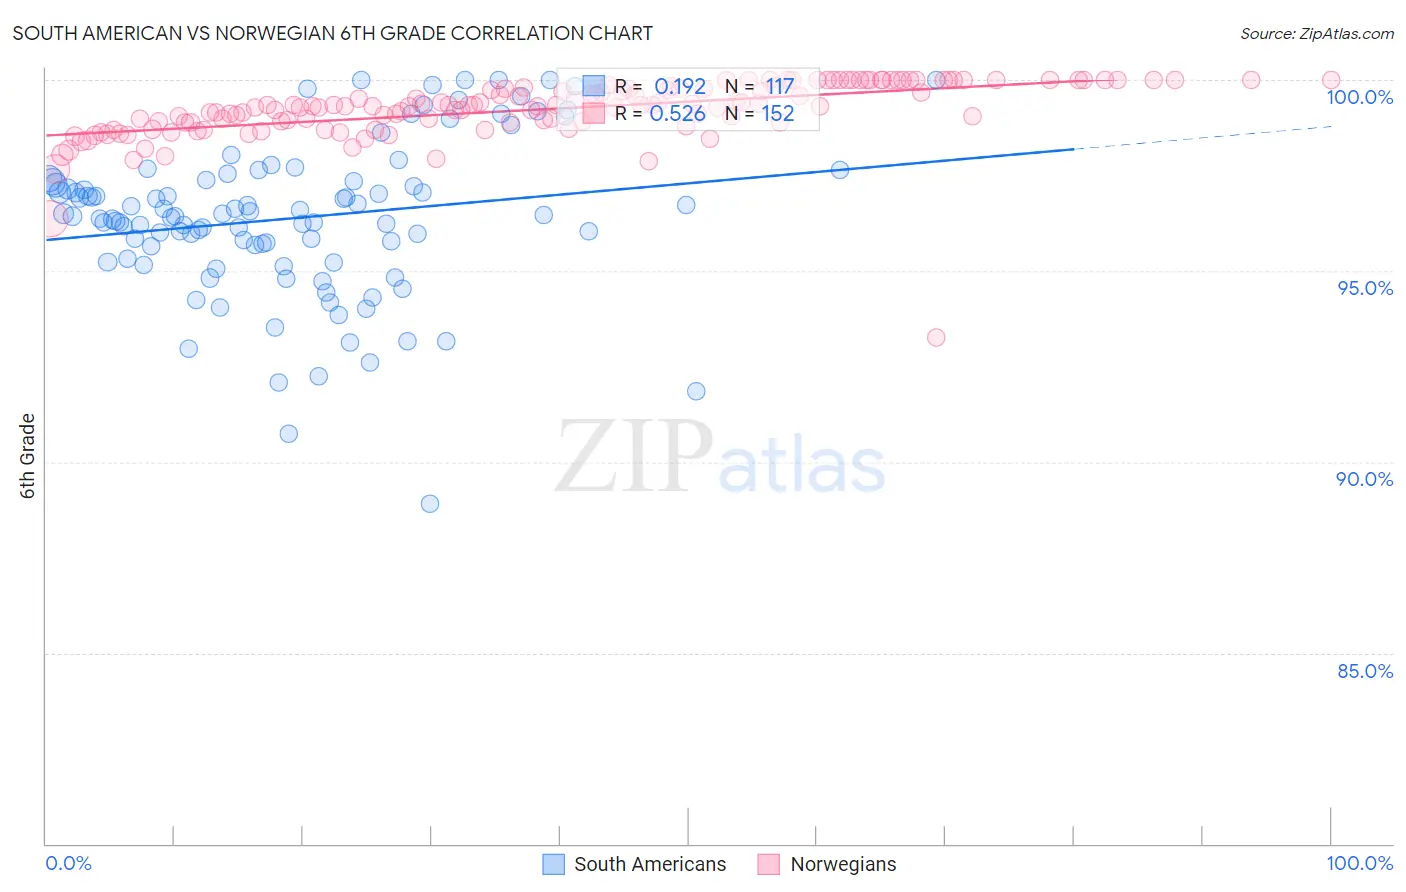
South American vs Norwegian 6th Grade Correlation Chart
The statistical analysis conducted on geographies consisting of 494,178,447 people shows a poor positive correlation between the proportion of South Americans and percentage of population with at least 6th grade education in the United States with a correlation coefficient (R) of 0.192 and weighted average of 96.4%. Similarly, the statistical analysis conducted on geographies consisting of 533,395,488 people shows a substantial positive correlation between the proportion of Norwegians and percentage of population with at least 6th grade education in the United States with a correlation coefficient (R) of 0.526 and weighted average of 98.3%, a difference of 1.9%.
6th Grade Correlation Summary
| Measurement | South American | Norwegian |
| Minimum | 88.9% | 93.2% |
| Maximum | 100.0% | 100.0% |
| Range | 11.1% | 6.8% |
| Mean | 96.4% | 99.2% |
| Median | 96.4% | 99.3% |
| Interquartile 25% (IQ1) | 95.5% | 98.9% |
| Interquartile 75% (IQ3) | 97.4% | 99.8% |
| Interquartile Range (IQR) | 1.9% | 0.92% |
| Standard Deviation (Sample) | 2.0% | 0.79% |
| Standard Deviation (Population) | 2.0% | 0.79% |
Similar Demographics by 6th Grade
Demographics Similar to South Americans by 6th Grade
In terms of 6th grade, the demographic groups most similar to South Americans are Immigrants from China (96.4%, a difference of 0.0%), Peruvian (96.4%, a difference of 0.0%), Immigrants from Sierra Leone (96.4%, a difference of 0.010%), Taiwanese (96.5%, a difference of 0.020%), and U.S. Virgin Islander (96.5%, a difference of 0.030%).
| Demographics | Rating | Rank | 6th Grade |
| Immigrants | Uruguay | 0.6 /100 | #252 | Tragic 96.5% |
| Jamaicans | 0.6 /100 | #253 | Tragic 96.5% |
| Immigrants | Ethiopia | 0.6 /100 | #254 | Tragic 96.5% |
| Immigrants | Congo | 0.6 /100 | #255 | Tragic 96.5% |
| U.S. Virgin Islanders | 0.5 /100 | #256 | Tragic 96.5% |
| Taiwanese | 0.5 /100 | #257 | Tragic 96.5% |
| Immigrants | China | 0.4 /100 | #258 | Tragic 96.4% |
| South Americans | 0.4 /100 | #259 | Tragic 96.4% |
| Peruvians | 0.4 /100 | #260 | Tragic 96.4% |
| Immigrants | Sierra Leone | 0.4 /100 | #261 | Tragic 96.4% |
| Immigrants | Nigeria | 0.3 /100 | #262 | Tragic 96.4% |
| Immigrants | Colombia | 0.3 /100 | #263 | Tragic 96.4% |
| Armenians | 0.3 /100 | #264 | Tragic 96.4% |
| Immigrants | Jamaica | 0.2 /100 | #265 | Tragic 96.4% |
| Ghanaians | 0.2 /100 | #266 | Tragic 96.4% |
Demographics Similar to Norwegians by 6th Grade
In terms of 6th grade, the demographic groups most similar to Norwegians are Tsimshian (98.3%, a difference of 0.0%), German (98.2%, a difference of 0.040%), Slovak (98.2%, a difference of 0.040%), Dutch (98.4%, a difference of 0.070%), and Slovene (98.2%, a difference of 0.10%).
| Demographics | Rating | Rank | 6th Grade |
| Crow | 100.0 /100 | #1 | Exceptional 99.4% |
| Ottawa | 100.0 /100 | #2 | Exceptional 98.5% |
| Welsh | 100.0 /100 | #3 | Exceptional 98.5% |
| Dutch | 100.0 /100 | #4 | Exceptional 98.4% |
| Tsimshian | 100.0 /100 | #5 | Exceptional 98.3% |
| Norwegians | 100.0 /100 | #6 | Exceptional 98.3% |
| Germans | 100.0 /100 | #7 | Exceptional 98.2% |
| Slovaks | 100.0 /100 | #8 | Exceptional 98.2% |
| Slovenes | 100.0 /100 | #9 | Exceptional 98.2% |
| Swedes | 100.0 /100 | #10 | Exceptional 98.2% |
| English | 100.0 /100 | #11 | Exceptional 98.1% |
| Alaskan Athabascans | 100.0 /100 | #12 | Exceptional 98.1% |
| Tlingit-Haida | 100.0 /100 | #13 | Exceptional 98.1% |
| Carpatho Rusyns | 100.0 /100 | #14 | Exceptional 98.1% |
| Inupiat | 100.0 /100 | #15 | Exceptional 98.1% |