South American vs Immigrants from South Africa Kindergarten

COMPARE

South American
Race
Ancestry
AfghanAfricanAlaska NativeAlaskan AthabascanAlbanianAleutAlsatianAmericanApacheArabArapahoArgentineanArmenianAssyrian/Chaldean/SyriacAustralianAustrianBahamianBangladeshiBarbadianBasqueBelgianBelizeanBermudanBhutaneseBlackfeetBolivianBrazilianBritishBritish West IndianBulgarianBurmeseCajunCambodianCanadianCape VerdeanCarpatho RusynCelticCentral AmericanCentral American IndianCherokeeCheyenneChickasawChileanChineseChippewaChoctawColombianColvilleComancheCosta RicanCreeCreekCroatianCrowCubanCypriotCzechCzechoslovakianDanishDelawareDominicanDutchDutch West IndianEastern EuropeanEcuadorianEgyptianEnglishEstonianEthiopianEuropeanFijianFilipinoFinnishFrenchFrench American IndianFrench CanadianGermanGerman RussianGhanaianGreekGuamanian/ChamorroGuatemalanGuyaneseHaitianHmongHonduranHopiHoumaHungarianIcelanderIndian (Asian)IndonesianInupiatIranianIraqiIrishIroquoisIsraeliItalianJamaicanJapaneseJordanianKenyanKiowaKoreanLaotianLatvianLebaneseLiberianLithuanianLumbeeLuxembourgerMacedonianMalaysianMalteseMarshalleseMenomineeMexicanMexican American IndianMongolianMoroccanNative HawaiianNavajoNepaleseNew ZealanderNicaraguanNigerianNorthern EuropeanNorwegianOkinawanOsageOttawaPaiutePakistaniPalestinianPanamanianParaguayanPennsylvania GermanPeruvianPimaPolishPortuguesePotawatomiPuebloPuerto RicanPuget Sound SalishRomanianRussianSalvadoranSamoanScandinavianScotch-IrishScottishSeminoleSenegaleseSerbianShoshoneSierra LeoneanSiouxSlavicSlovakSloveneSomaliSouth AfricanSouth AmericanSouth American IndianSoviet UnionSpaniardSpanishSpanish AmericanSpanish American IndianSri LankanSubsaharan AfricanSudaneseSwedishSwissSyrianTaiwaneseThaiTlingit-HaidaTohono O'OdhamTonganTrinidadian and TobagonianTsimshianTurkishU.S. Virgin IslanderUgandanUkrainianUruguayanUteVenezuelanVietnameseWelshWest IndianYakamaYaquiYugoslavianYumanYup'ikZimbabwean
Immigration
NonimmigrantsImmigrantsAfghanistanAfricaAlbaniaArgentinaArmeniaAsiaAustraliaAustriaBahamasBangladeshBarbadosBelarusBelgiumBelizeBoliviaBosnia and HerzegovinaBrazilBulgariaBurma/MyanmarCabo VerdeCambodiaCameroonCanadaCaribbeanCentral AmericaChileChinaColombiaCongoCosta RicaCroatiaCubaCzechoslovakiaDenmarkDominicaDominican RepublicEastern AfricaEastern AsiaEastern EuropeEcuadorEgyptEl SalvadorEnglandEritreaEthiopiaEuropeFijiFranceGermanyGhanaGreeceGrenadaGuatemalaGuyanaHaitiHondurasHong KongHungaryIndiaIndonesiaIranIraqIrelandIsraelItalyJamaicaJapanJordanKazakhstanKenyaKoreaKuwaitLaosLatin AmericaLatviaLebanonLiberiaLithuaniaMalaysiaMexicoMicronesiaMiddle AfricaMoldovaMoroccoNepalNetherlandsNicaraguaNigeriaNorth AmericaNorth MacedoniaNorthern AfricaNorthern EuropeNorwayOceaniaPakistanPanamaPeruPhilippinesPolandPortugalRomaniaRussiaSaudi ArabiaScotlandSenegalSerbiaSierra LeoneSingaporeSomaliaSouth AmericaSouth Central AsiaSouth Eastern AsiaSouthern EuropeSpainSri LankaSt. Vincent and the GrenadinesSudanSwedenSwitzerlandSyriaTaiwanThailandTrinidad and TobagoTurkeyUgandaUkraineUruguayUzbekistanVenezuelaVietnamWest IndiesWestern AfricaWestern AsiaWestern EuropeYemenZaireZimbabweAzores
Immigrants from South Africa
Race
Ancestry
AfghanAfricanAlaska NativeAlaskan AthabascanAlbanianAleutAlsatianAmericanApacheArabArapahoArgentineanArmenianAssyrian/Chaldean/SyriacAustralianAustrianBahamianBangladeshiBarbadianBasqueBelgianBelizeanBermudanBhutaneseBlackfeetBolivianBrazilianBritishBritish West IndianBulgarianBurmeseCajunCambodianCanadianCape VerdeanCarpatho RusynCelticCentral AmericanCentral American IndianCherokeeCheyenneChickasawChileanChineseChippewaChoctawColombianColvilleComancheCosta RicanCreeCreekCroatianCrowCubanCypriotCzechCzechoslovakianDanishDelawareDominicanDutchDutch West IndianEastern EuropeanEcuadorianEgyptianEnglishEstonianEthiopianEuropeanFijianFilipinoFinnishFrenchFrench American IndianFrench CanadianGermanGerman RussianGhanaianGreekGuamanian/ChamorroGuatemalanGuyaneseHaitianHmongHonduranHopiHoumaHungarianIcelanderIndian (Asian)IndonesianInupiatIranianIraqiIrishIroquoisIsraeliItalianJamaicanJapaneseJordanianKenyanKiowaKoreanLaotianLatvianLebaneseLiberianLithuanianLumbeeLuxembourgerMacedonianMalaysianMalteseMarshalleseMenomineeMexicanMexican American IndianMongolianMoroccanNative HawaiianNavajoNepaleseNew ZealanderNicaraguanNigerianNorthern EuropeanNorwegianOkinawanOsageOttawaPaiutePakistaniPalestinianPanamanianParaguayanPennsylvania GermanPeruvianPimaPolishPortuguesePotawatomiPuebloPuerto RicanPuget Sound SalishRomanianRussianSalvadoranSamoanScandinavianScotch-IrishScottishSeminoleSenegaleseSerbianShoshoneSierra LeoneanSiouxSlavicSlovakSloveneSomaliSouth AfricanSouth American IndianSoviet UnionSpaniardSpanishSpanish AmericanSpanish American IndianSri LankanSubsaharan AfricanSudaneseSwedishSwissSyrianTaiwaneseThaiTlingit-HaidaTohono O'OdhamTonganTrinidadian and TobagonianTsimshianTurkishU.S. Virgin IslanderUgandanUkrainianUruguayanUteVenezuelanVietnameseWelshWest IndianYakamaYaquiYugoslavianYumanYup'ikZimbabwean
Immigration
NonimmigrantsImmigrantsAfghanistanAfricaAlbaniaArgentinaArmeniaAsiaAustraliaAustriaBahamasBangladeshBarbadosBelarusBelgiumBelizeBoliviaBosnia and HerzegovinaBrazilBulgariaBurma/MyanmarCabo VerdeCambodiaCameroonCanadaCaribbeanCentral AmericaChileChinaColombiaCongoCosta RicaCroatiaCubaCzechoslovakiaDenmarkDominicaDominican RepublicEastern AfricaEastern AsiaEastern EuropeEcuadorEgyptEl SalvadorEnglandEritreaEthiopiaEuropeFijiFranceGermanyGhanaGreeceGrenadaGuatemalaGuyanaHaitiHondurasHong KongHungaryIndiaIndonesiaIranIraqIrelandIsraelItalyJamaicaJapanJordanKazakhstanKenyaKoreaKuwaitLaosLatin AmericaLatviaLebanonLiberiaLithuaniaMalaysiaMexicoMicronesiaMiddle AfricaMoldovaMoroccoNepalNetherlandsNicaraguaNigeriaNorth AmericaNorth MacedoniaNorthern AfricaNorthern EuropeNorwayOceaniaPakistanPanamaPeruPhilippinesPolandPortugalRomaniaRussiaSaudi ArabiaScotlandSenegalSerbiaSierra LeoneSingaporeSomaliaSouth AfricaSouth AmericaSouth Central AsiaSouth Eastern AsiaSouthern EuropeSpainSri LankaSt. Vincent and the GrenadinesSudanSwedenSwitzerlandSyriaTaiwanThailandTrinidad and TobagoTurkeyUgandaUkraineUruguayUzbekistanVenezuelaVietnamWest IndiesWestern AfricaWestern AsiaWestern EuropeYemenZaireZimbabweAzores
Kindergarten
Income
Poverty
Unemployment
Labor Participation
Family Structure
Vehicle Availability
Education Level
Disability

Kindergarten Comparison

South Americans

Immigrants from South Africa

Tragic
Exceptional
97.6%
KINDERGARTEN
1.1/ 100
METRIC RATING
245th/ 347
METRIC RANK
98.3%
KINDERGARTEN
98.8/ 100
METRIC RATING
89th/ 347
METRIC RANK

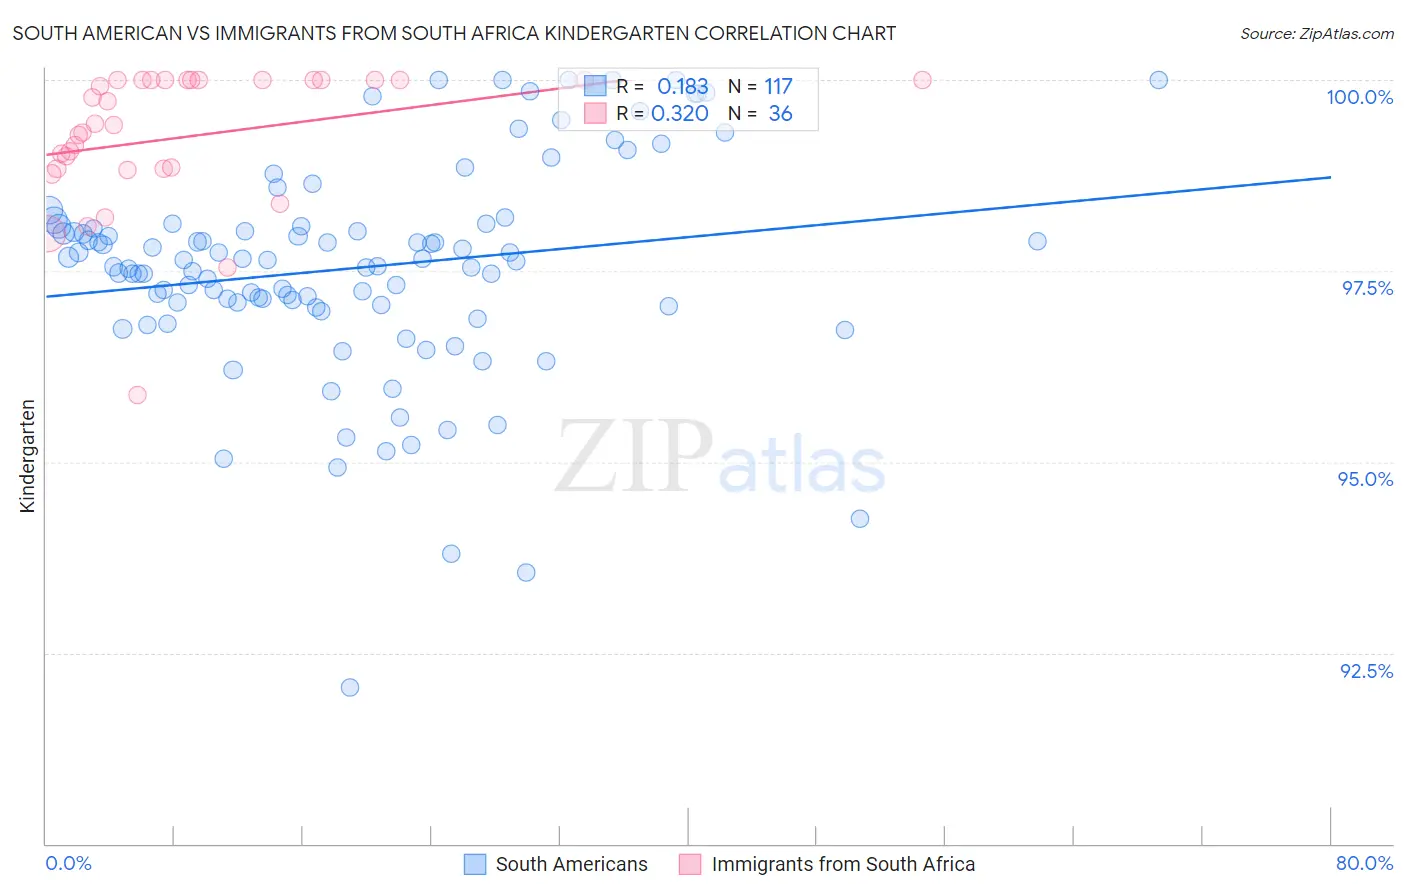
South American vs Immigrants from South Africa Kindergarten Correlation Chart

The statistical analysis conducted on geographies consisting of 494,178,447 people shows a poor positive correlation between the proportion of South Americans and percentage of population with at least kindergarten education in the United States with a correlation coefficient (R) of 0.183 and weighted average of 97.6%. Similarly, the statistical analysis conducted on geographies consisting of 233,321,693 people shows a mild positive correlation between the proportion of Immigrants from South Africa and percentage of population with at least kindergarten education in the United States with a correlation coefficient (R) of 0.320 and weighted average of 98.3%, a difference of 0.69%.
South American vs Immigrants from South Africa Kindergarten

Kindergarten Correlation Summary

MeasurementSouth AmericanImmigrants from South Africa
Minimum92.1%95.9%
Maximum100.0%100.0%
Range7.9%4.1%
Mean97.5%99.3%
Median97.6%99.4%
Interquartile 25% (IQ1)97.0%98.8%
Interquartile 75% (IQ3)98.1%100.0%
Interquartile Range (IQR)1.0%1.2%
Standard Deviation (Sample)1.4%0.91%
Standard Deviation (Population)1.4%0.90%

Similar Demographics by Kindergarten

Demographics Similar to South Americans by Kindergarten

In terms of kindergarten, the demographic groups most similar to South Americans are Indian (Asian) (97.6%, a difference of 0.0%), Immigrants from Eastern Africa (97.6%, a difference of 0.0%), Immigrants from Middle Africa (97.6%, a difference of 0.0%), Liberian (97.6%, a difference of 0.010%), and Immigrants from Indonesia (97.6%, a difference of 0.010%).
DemographicsRating | RankKindergarten
Immigrants | Eastern Asia
1.7
/100
|
#238
Tragic
97.6%
U.S. Virgin Islanders
1.7
/100
|
#239
Tragic
97.6%
Koreans
1.6
/100
|
#240
Tragic
97.6%
Liberians
1.3
/100
|
#241
Tragic
97.6%
Immigrants | Indonesia
1.3
/100
|
#242
Tragic
97.6%
Asians
1.2
/100
|
#243
Tragic
97.6%
Bolivians
1.2
/100
|
#244
Tragic
97.6%
South Americans
1.1
/100
|
#245
Tragic
97.6%
Indians (Asian)
1.0
/100
|
#246
Tragic
97.6%
Immigrants | Eastern Africa
1.0
/100
|
#247
Tragic
97.6%
Immigrants | Middle Africa
1.0
/100
|
#248
Tragic
97.6%
Peruvians
1.0
/100
|
#249
Tragic
97.6%
Immigrants | Senegal
0.9
/100
|
#250
Tragic
97.6%
Ethiopians
0.9
/100
|
#251
Tragic
97.6%
Immigrants | Iraq
0.9
/100
|
#252
Tragic
97.6%

Demographics Similar to Immigrants from South Africa by Kindergarten

In terms of kindergarten, the demographic groups most similar to Immigrants from South Africa are Ukrainian (98.3%, a difference of 0.0%), Zimbabwean (98.3%, a difference of 0.0%), Immigrants from Western Europe (98.3%, a difference of 0.0%), Hopi (98.3%, a difference of 0.010%), and Immigrants from Australia (98.3%, a difference of 0.010%).
DemographicsRating | RankKindergarten
Potawatomi
99.2
/100
|
#82
Exceptional
98.3%
Osage
99.1
/100
|
#83
Exceptional
98.3%
Immigrants | Denmark
99.1
/100
|
#84
Exceptional
98.3%
Immigrants | Sweden
99.1
/100
|
#85
Exceptional
98.3%
Hopi
99.0
/100
|
#86
Exceptional
98.3%
Immigrants | Australia
99.0
/100
|
#87
Exceptional
98.3%
Ukrainians
98.8
/100
|
#88
Exceptional
98.3%
Immigrants | South Africa
98.8
/100
|
#89
Exceptional
98.3%
Zimbabweans
98.8
/100
|
#90
Exceptional
98.3%
Immigrants | Western Europe
98.8
/100
|
#91
Exceptional
98.3%
Macedonians
98.7
/100
|
#92
Exceptional
98.3%
Immigrants | India
98.6
/100
|
#93
Exceptional
98.3%
South Africans
98.5
/100
|
#94
Exceptional
98.3%
Immigrants | Germany
98.5
/100
|
#95
Exceptional
98.3%
Immigrants | Nonimmigrants
98.3
/100
|
#96
Exceptional
98.3%