South American vs Hungarian Nursery School
COMPARE
South American
Hungarian
Nursery School
Nursery School Comparison
South Americans
Hungarians
97.6%
NURSERY SCHOOL
1.0/ 100
METRIC RATING
244th/ 347
METRIC RANK
98.5%
NURSERY SCHOOL
99.9/ 100
METRIC RATING
46th/ 347
METRIC RANK
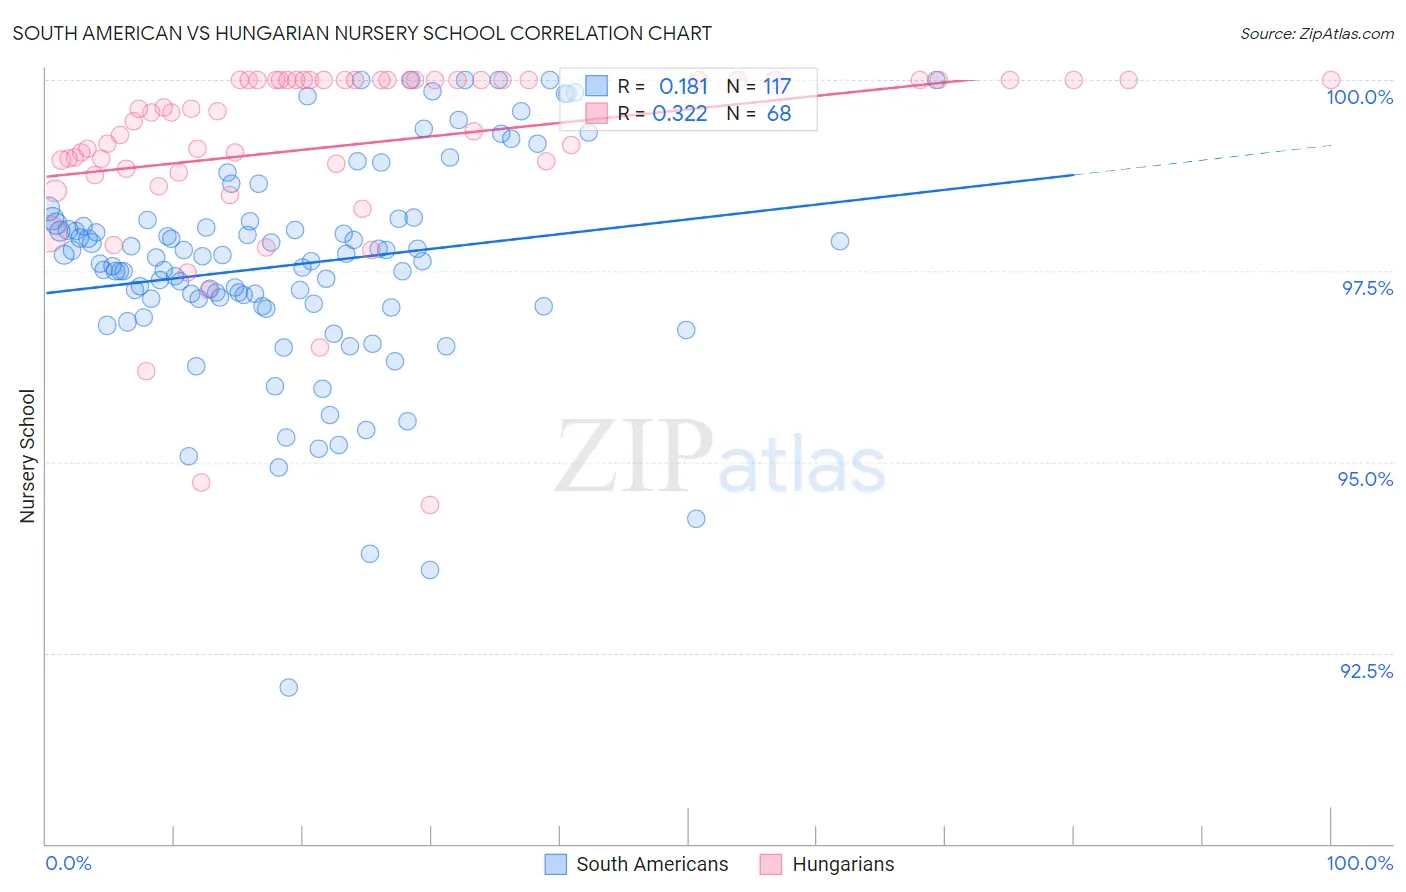
South American vs Hungarian Nursery School Correlation Chart
The statistical analysis conducted on geographies consisting of 494,178,447 people shows a poor positive correlation between the proportion of South Americans and percentage of population with at least nursery school education in the United States with a correlation coefficient (R) of 0.181 and weighted average of 97.6%. Similarly, the statistical analysis conducted on geographies consisting of 486,239,439 people shows a mild positive correlation between the proportion of Hungarians and percentage of population with at least nursery school education in the United States with a correlation coefficient (R) of 0.322 and weighted average of 98.5%, a difference of 0.85%.
Nursery School Correlation Summary
| Measurement | South American | Hungarian |
| Minimum | 92.1% | 94.4% |
| Maximum | 100.0% | 100.0% |
| Range | 7.9% | 5.6% |
| Mean | 97.6% | 99.2% |
| Median | 97.7% | 99.6% |
| Interquartile 25% (IQ1) | 97.1% | 98.9% |
| Interquartile 75% (IQ3) | 98.2% | 100.0% |
| Interquartile Range (IQR) | 1.1% | 1.1% |
| Standard Deviation (Sample) | 1.4% | 1.2% |
| Standard Deviation (Population) | 1.4% | 1.2% |
Similar Demographics by Nursery School
Demographics Similar to South Americans by Nursery School
In terms of nursery school, the demographic groups most similar to South Americans are Asian (97.6%, a difference of 0.0%), Bolivian (97.6%, a difference of 0.0%), Peruvian (97.6%, a difference of 0.0%), Immigrants from Indonesia (97.7%, a difference of 0.010%), and Liberian (97.7%, a difference of 0.010%).
| Demographics | Rating | Rank | Nursery School |
| Immigrants | Western Asia | 1.9 /100 | #237 | Tragic 97.7% |
| Nigerians | 1.7 /100 | #238 | Tragic 97.7% |
| Immigrants | Eastern Asia | 1.6 /100 | #239 | Tragic 97.7% |
| Koreans | 1.4 /100 | #240 | Tragic 97.7% |
| Immigrants | Indonesia | 1.1 /100 | #241 | Tragic 97.7% |
| Liberians | 1.1 /100 | #242 | Tragic 97.7% |
| Asians | 1.1 /100 | #243 | Tragic 97.6% |
| South Americans | 1.0 /100 | #244 | Tragic 97.6% |
| Bolivians | 1.0 /100 | #245 | Tragic 97.6% |
| Peruvians | 1.0 /100 | #246 | Tragic 97.6% |
| Immigrants | Middle Africa | 0.9 /100 | #247 | Tragic 97.6% |
| Indians (Asian) | 0.9 /100 | #248 | Tragic 97.6% |
| Immigrants | Eastern Africa | 0.9 /100 | #249 | Tragic 97.6% |
| Immigrants | Senegal | 0.9 /100 | #250 | Tragic 97.6% |
| Ethiopians | 0.8 /100 | #251 | Tragic 97.6% |
Demographics Similar to Hungarians by Nursery School
In terms of nursery school, the demographic groups most similar to Hungarians are Belgian (98.5%, a difference of 0.020%), Northern European (98.5%, a difference of 0.020%), Czechoslovakian (98.5%, a difference of 0.020%), Ottawa (98.5%, a difference of 0.020%), and Luxembourger (98.5%, a difference of 0.030%).
| Demographics | Rating | Rank | Nursery School |
| Latvians | 99.9 /100 | #39 | Exceptional 98.5% |
| Chippewa | 99.9 /100 | #40 | Exceptional 98.5% |
| Luxembourgers | 99.9 /100 | #41 | Exceptional 98.5% |
| Eastern Europeans | 99.9 /100 | #42 | Exceptional 98.5% |
| Native Hawaiians | 99.9 /100 | #43 | Exceptional 98.5% |
| Belgians | 99.9 /100 | #44 | Exceptional 98.5% |
| Northern Europeans | 99.9 /100 | #45 | Exceptional 98.5% |
| Hungarians | 99.9 /100 | #46 | Exceptional 98.5% |
| Czechoslovakians | 99.9 /100 | #47 | Exceptional 98.5% |
| Ottawa | 99.8 /100 | #48 | Exceptional 98.5% |
| Whites/Caucasians | 99.8 /100 | #49 | Exceptional 98.5% |
| Celtics | 99.8 /100 | #50 | Exceptional 98.5% |
| Estonians | 99.8 /100 | #51 | Exceptional 98.5% |
| Australians | 99.8 /100 | #52 | Exceptional 98.5% |
| Kiowa | 99.8 /100 | #53 | Exceptional 98.4% |