South American vs Burmese 7th Grade
COMPARE
South American
Burmese
7th Grade
7th Grade Comparison
South Americans
Burmese
95.2%
7TH GRADE
0.5/ 100
METRIC RATING
261st/ 347
METRIC RANK
96.3%
7TH GRADE
87.1/ 100
METRIC RATING
142nd/ 347
METRIC RANK
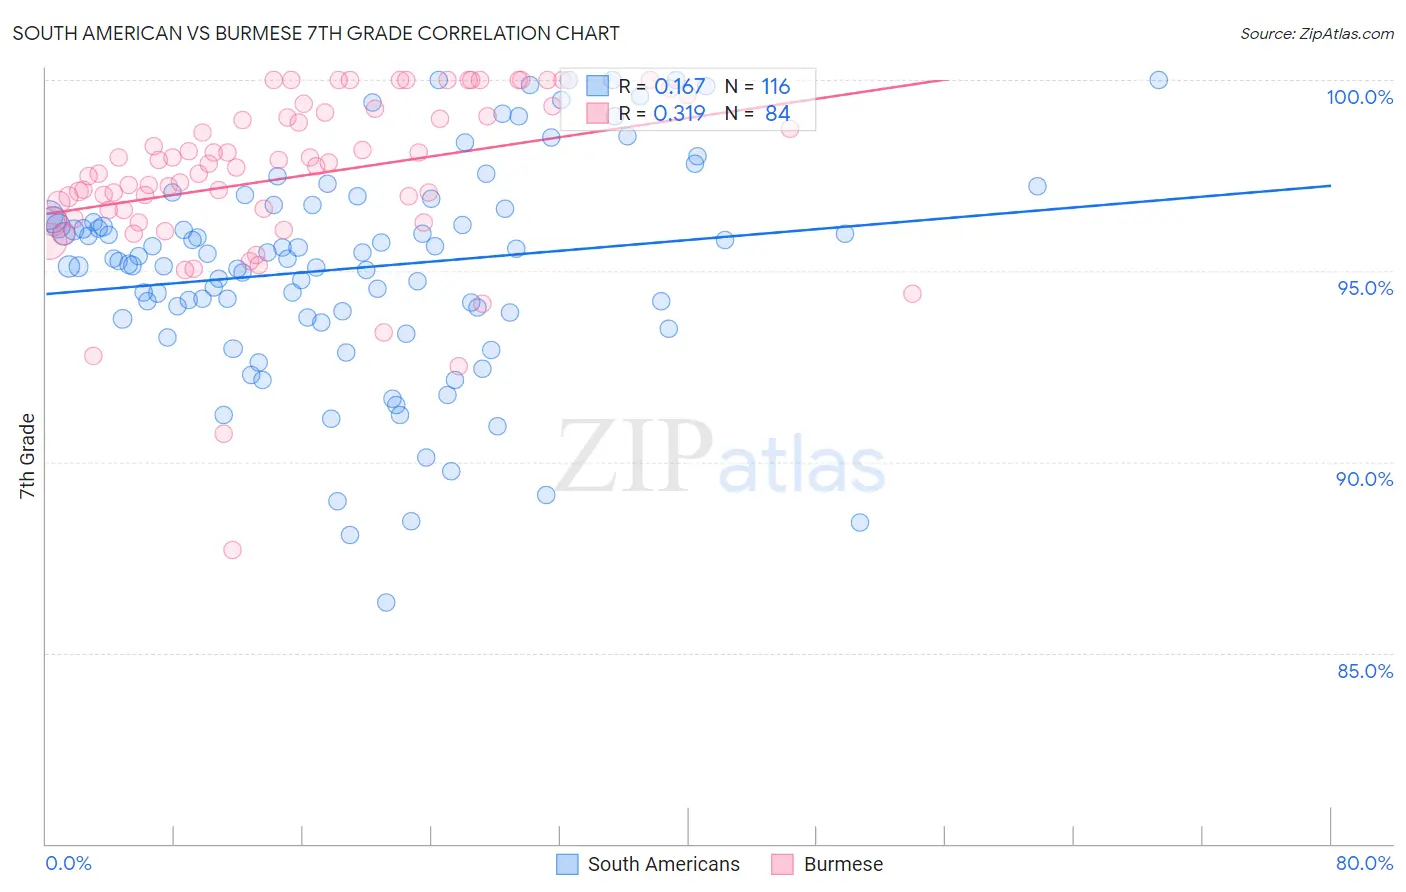
South American vs Burmese 7th Grade Correlation Chart
The statistical analysis conducted on geographies consisting of 494,065,697 people shows a poor positive correlation between the proportion of South Americans and percentage of population with at least 7th grade education in the United States with a correlation coefficient (R) of 0.167 and weighted average of 95.2%. Similarly, the statistical analysis conducted on geographies consisting of 465,275,888 people shows a mild positive correlation between the proportion of Burmese and percentage of population with at least 7th grade education in the United States with a correlation coefficient (R) of 0.319 and weighted average of 96.3%, a difference of 1.1%.
7th Grade Correlation Summary
| Measurement | South American | Burmese |
| Minimum | 86.3% | 87.7% |
| Maximum | 100.0% | 100.0% |
| Range | 13.7% | 12.3% |
| Mean | 95.1% | 97.5% |
| Median | 95.3% | 97.7% |
| Interquartile 25% (IQ1) | 93.8% | 96.5% |
| Interquartile 75% (IQ3) | 96.5% | 99.1% |
| Interquartile Range (IQR) | 2.7% | 2.6% |
| Standard Deviation (Sample) | 2.8% | 2.2% |
| Standard Deviation (Population) | 2.8% | 2.2% |
Similar Demographics by 7th Grade
Demographics Similar to South Americans by 7th Grade
In terms of 7th grade, the demographic groups most similar to South Americans are Immigrants from Somalia (95.2%, a difference of 0.0%), West Indian (95.2%, a difference of 0.0%), Afghan (95.3%, a difference of 0.010%), Immigrants from Nigeria (95.2%, a difference of 0.010%), and Immigrants from Costa Rica (95.3%, a difference of 0.040%).
| Demographics | Rating | Rank | 7th Grade |
| Colombians | 0.8 /100 | #254 | Tragic 95.3% |
| Koreans | 0.8 /100 | #255 | Tragic 95.3% |
| Immigrants | China | 0.7 /100 | #256 | Tragic 95.3% |
| Immigrants | Congo | 0.7 /100 | #257 | Tragic 95.3% |
| Ghanaians | 0.7 /100 | #258 | Tragic 95.3% |
| Immigrants | Costa Rica | 0.6 /100 | #259 | Tragic 95.3% |
| Afghans | 0.5 /100 | #260 | Tragic 95.3% |
| South Americans | 0.5 /100 | #261 | Tragic 95.2% |
| Immigrants | Somalia | 0.5 /100 | #262 | Tragic 95.2% |
| West Indians | 0.5 /100 | #263 | Tragic 95.2% |
| Immigrants | Nigeria | 0.4 /100 | #264 | Tragic 95.2% |
| Immigrants | Uruguay | 0.3 /100 | #265 | Tragic 95.2% |
| Immigrants | Ghana | 0.3 /100 | #266 | Tragic 95.2% |
| Yuman | 0.3 /100 | #267 | Tragic 95.2% |
| Immigrants | Hong Kong | 0.3 /100 | #268 | Tragic 95.2% |
Demographics Similar to Burmese by 7th Grade
In terms of 7th grade, the demographic groups most similar to Burmese are Immigrants from South Central Asia (96.3%, a difference of 0.0%), Spanish (96.3%, a difference of 0.010%), Cambodian (96.3%, a difference of 0.020%), Immigrants from Greece (96.3%, a difference of 0.020%), and Basque (96.4%, a difference of 0.030%).
| Demographics | Rating | Rank | 7th Grade |
| Immigrants | Kuwait | 91.1 /100 | #135 | Exceptional 96.4% |
| Immigrants | Hungary | 90.6 /100 | #136 | Exceptional 96.4% |
| Immigrants | Turkey | 90.2 /100 | #137 | Exceptional 96.4% |
| Jordanians | 90.0 /100 | #138 | Excellent 96.4% |
| Basques | 89.3 /100 | #139 | Excellent 96.4% |
| Cambodians | 88.3 /100 | #140 | Excellent 96.3% |
| Immigrants | South Central Asia | 87.1 /100 | #141 | Excellent 96.3% |
| Burmese | 87.1 /100 | #142 | Excellent 96.3% |
| Spanish | 86.6 /100 | #143 | Excellent 96.3% |
| Immigrants | Greece | 85.9 /100 | #144 | Excellent 96.3% |
| Blackfeet | 83.9 /100 | #145 | Excellent 96.3% |
| Immigrants | Eastern Europe | 83.7 /100 | #146 | Excellent 96.3% |
| French American Indians | 83.1 /100 | #147 | Excellent 96.3% |
| Israelis | 82.8 /100 | #148 | Excellent 96.3% |
| Albanians | 82.6 /100 | #149 | Excellent 96.3% |