South American Indian vs Russian Kindergarten

COMPARE

South American Indian
Race
Ancestry
AfghanAfricanAlaska NativeAlaskan AthabascanAlbanianAleutAlsatianAmericanApacheArabArapahoArgentineanArmenianAssyrian/Chaldean/SyriacAustralianAustrianBahamianBangladeshiBarbadianBasqueBelgianBelizeanBermudanBhutaneseBlackfeetBolivianBrazilianBritishBritish West IndianBulgarianBurmeseCajunCambodianCanadianCape VerdeanCarpatho RusynCelticCentral AmericanCentral American IndianCherokeeCheyenneChickasawChileanChineseChippewaChoctawColombianColvilleComancheCosta RicanCreeCreekCroatianCrowCubanCypriotCzechCzechoslovakianDanishDelawareDominicanDutchDutch West IndianEastern EuropeanEcuadorianEgyptianEnglishEstonianEthiopianEuropeanFijianFilipinoFinnishFrenchFrench American IndianFrench CanadianGermanGerman RussianGhanaianGreekGuamanian/ChamorroGuatemalanGuyaneseHaitianHmongHonduranHopiHoumaHungarianIcelanderIndian (Asian)IndonesianInupiatIranianIraqiIrishIroquoisIsraeliItalianJamaicanJapaneseJordanianKenyanKiowaKoreanLaotianLatvianLebaneseLiberianLithuanianLumbeeLuxembourgerMacedonianMalaysianMalteseMarshalleseMenomineeMexicanMexican American IndianMongolianMoroccanNative HawaiianNavajoNepaleseNew ZealanderNicaraguanNigerianNorthern EuropeanNorwegianOkinawanOsageOttawaPaiutePakistaniPalestinianPanamanianParaguayanPennsylvania GermanPeruvianPimaPolishPortuguesePotawatomiPuebloPuerto RicanPuget Sound SalishRomanianSalvadoranSamoanScandinavianScotch-IrishScottishSeminoleSenegaleseSerbianShoshoneSierra LeoneanSiouxSlavicSlovakSloveneSomaliSouth AfricanSouth AmericanSouth American IndianSoviet UnionSpaniardSpanishSpanish AmericanSpanish American IndianSri LankanSubsaharan AfricanSudaneseSwedishSwissSyrianTaiwaneseThaiTlingit-HaidaTohono O'OdhamTonganTrinidadian and TobagonianTsimshianTurkishU.S. Virgin IslanderUgandanUkrainianUruguayanUteVenezuelanVietnameseWelshWest IndianYakamaYaquiYugoslavianYumanYup'ikZimbabwean
Immigration
NonimmigrantsImmigrantsAfghanistanAfricaAlbaniaArgentinaArmeniaAsiaAustraliaAustriaBahamasBangladeshBarbadosBelarusBelgiumBelizeBoliviaBosnia and HerzegovinaBrazilBulgariaBurma/MyanmarCabo VerdeCambodiaCameroonCanadaCaribbeanCentral AmericaChileChinaColombiaCongoCosta RicaCroatiaCubaCzechoslovakiaDenmarkDominicaDominican RepublicEastern AfricaEastern AsiaEastern EuropeEcuadorEgyptEl SalvadorEnglandEritreaEthiopiaEuropeFijiFranceGermanyGhanaGreeceGrenadaGuatemalaGuyanaHaitiHondurasHong KongHungaryIndiaIndonesiaIranIraqIrelandIsraelItalyJamaicaJapanJordanKazakhstanKenyaKoreaKuwaitLaosLatin AmericaLatviaLebanonLiberiaLithuaniaMalaysiaMexicoMicronesiaMiddle AfricaMoldovaMoroccoNepalNetherlandsNicaraguaNigeriaNorth AmericaNorth MacedoniaNorthern AfricaNorthern EuropeNorwayOceaniaPakistanPanamaPeruPhilippinesPolandPortugalRomaniaRussiaSaudi ArabiaScotlandSenegalSerbiaSierra LeoneSingaporeSomaliaSouth AfricaSouth AmericaSouth Central AsiaSouth Eastern AsiaSouthern EuropeSpainSri LankaSt. Vincent and the GrenadinesSudanSwedenSwitzerlandSyriaTaiwanThailandTrinidad and TobagoTurkeyUgandaUkraineUruguayUzbekistanVenezuelaVietnamWest IndiesWestern AfricaWestern AsiaWestern EuropeYemenZaireZimbabweAzores
Russian
Race
Ancestry
AfghanAfricanAlaska NativeAlaskan AthabascanAlbanianAleutAlsatianAmericanApacheArabArapahoArgentineanArmenianAssyrian/Chaldean/SyriacAustralianAustrianBahamianBangladeshiBarbadianBasqueBelgianBelizeanBermudanBhutaneseBlackfeetBolivianBrazilianBritishBritish West IndianBulgarianBurmeseCajunCambodianCanadianCape VerdeanCarpatho RusynCelticCentral AmericanCentral American IndianCherokeeCheyenneChickasawChileanChineseChippewaChoctawColombianColvilleComancheCosta RicanCreeCreekCroatianCrowCubanCypriotCzechCzechoslovakianDanishDelawareDominicanDutchDutch West IndianEastern EuropeanEcuadorianEgyptianEnglishEstonianEthiopianEuropeanFijianFilipinoFinnishFrenchFrench American IndianFrench CanadianGermanGerman RussianGhanaianGreekGuamanian/ChamorroGuatemalanGuyaneseHaitianHmongHonduranHopiHoumaHungarianIcelanderIndian (Asian)IndonesianInupiatIranianIraqiIrishIroquoisIsraeliItalianJamaicanJapaneseJordanianKenyanKiowaKoreanLaotianLatvianLebaneseLiberianLithuanianLumbeeLuxembourgerMacedonianMalaysianMalteseMarshalleseMenomineeMexicanMexican American IndianMongolianMoroccanNative HawaiianNavajoNepaleseNew ZealanderNicaraguanNigerianNorthern EuropeanNorwegianOkinawanOsageOttawaPaiutePakistaniPalestinianPanamanianParaguayanPennsylvania GermanPeruvianPimaPolishPortuguesePotawatomiPuebloPuerto RicanPuget Sound SalishRomanianRussianSalvadoranSamoanScandinavianScotch-IrishScottishSeminoleSenegaleseSerbianShoshoneSierra LeoneanSiouxSlavicSlovakSloveneSomaliSouth AfricanSouth AmericanSoviet UnionSpaniardSpanishSpanish AmericanSpanish American IndianSri LankanSubsaharan AfricanSudaneseSwedishSwissSyrianTaiwaneseThaiTlingit-HaidaTohono O'OdhamTonganTrinidadian and TobagonianTsimshianTurkishU.S. Virgin IslanderUgandanUkrainianUruguayanUteVenezuelanVietnameseWelshWest IndianYakamaYaquiYugoslavianYumanYup'ikZimbabwean
Immigration
NonimmigrantsImmigrantsAfghanistanAfricaAlbaniaArgentinaArmeniaAsiaAustraliaAustriaBahamasBangladeshBarbadosBelarusBelgiumBelizeBoliviaBosnia and HerzegovinaBrazilBulgariaBurma/MyanmarCabo VerdeCambodiaCameroonCanadaCaribbeanCentral AmericaChileChinaColombiaCongoCosta RicaCroatiaCubaCzechoslovakiaDenmarkDominicaDominican RepublicEastern AfricaEastern AsiaEastern EuropeEcuadorEgyptEl SalvadorEnglandEritreaEthiopiaEuropeFijiFranceGermanyGhanaGreeceGrenadaGuatemalaGuyanaHaitiHondurasHong KongHungaryIndiaIndonesiaIranIraqIrelandIsraelItalyJamaicaJapanJordanKazakhstanKenyaKoreaKuwaitLaosLatin AmericaLatviaLebanonLiberiaLithuaniaMalaysiaMexicoMicronesiaMiddle AfricaMoldovaMoroccoNepalNetherlandsNicaraguaNigeriaNorth AmericaNorth MacedoniaNorthern AfricaNorthern EuropeNorwayOceaniaPakistanPanamaPeruPhilippinesPolandPortugalRomaniaRussiaSaudi ArabiaScotlandSenegalSerbiaSierra LeoneSingaporeSomaliaSouth AfricaSouth AmericaSouth Central AsiaSouth Eastern AsiaSouthern EuropeSpainSri LankaSt. Vincent and the GrenadinesSudanSwedenSwitzerlandSyriaTaiwanThailandTrinidad and TobagoTurkeyUgandaUkraineUruguayUzbekistanVenezuelaVietnamWest IndiesWestern AfricaWestern AsiaWestern EuropeYemenZaireZimbabweAzores
Kindergarten
Income
Poverty
Unemployment
Labor Participation
Family Structure
Vehicle Availability
Education Level
Disability

Kindergarten Comparison

South American Indians

Russians

Tragic
Exceptional
97.8%
KINDERGARTEN
7.7/ 100
METRIC RATING
213th/ 347
METRIC RANK
98.4%
KINDERGARTEN
99.6/ 100
METRIC RATING
70th/ 347
METRIC RANK

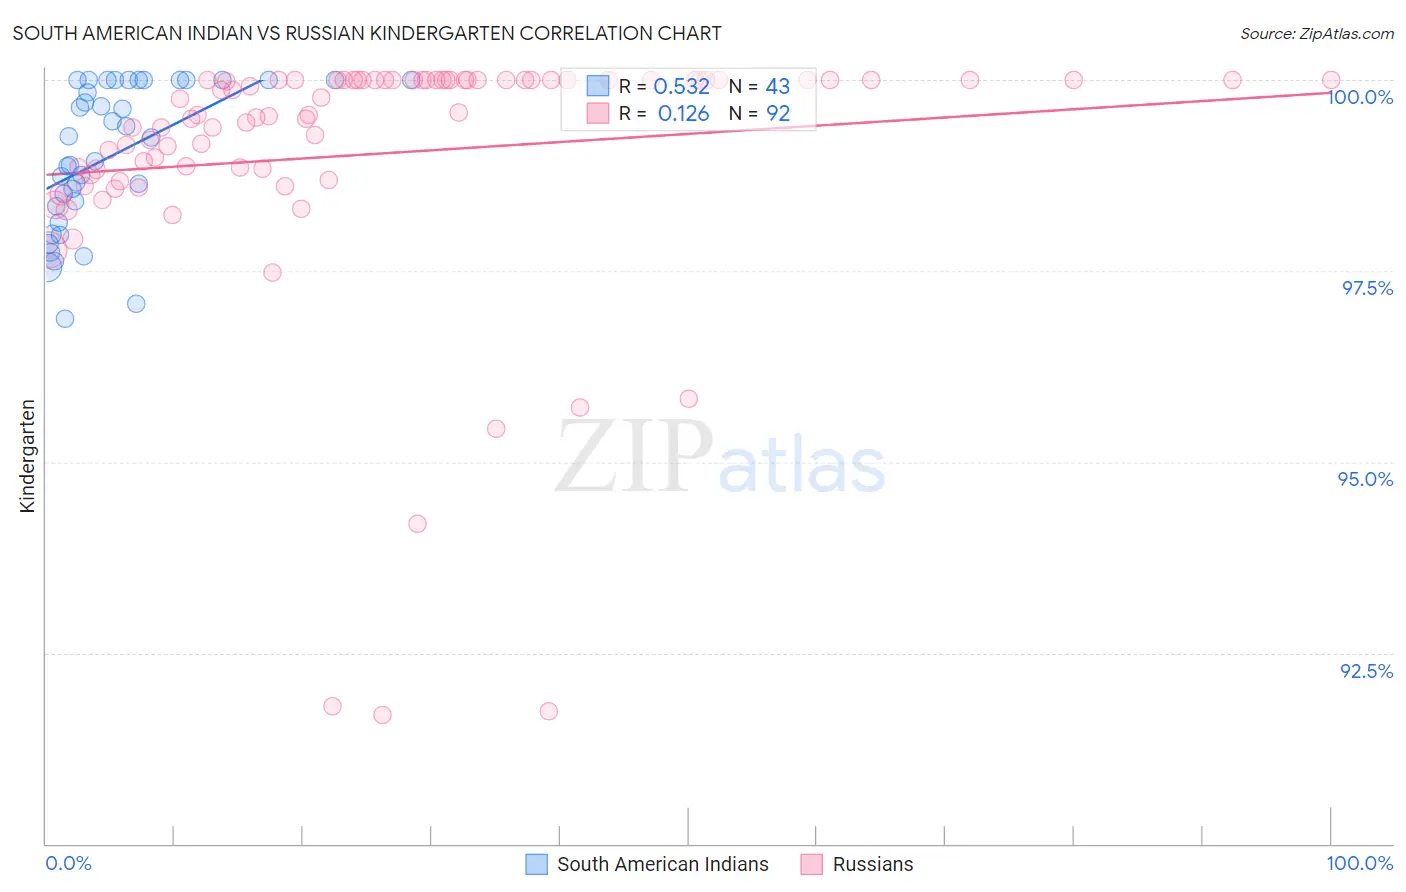
South American Indian vs Russian Kindergarten Correlation Chart

The statistical analysis conducted on geographies consisting of 164,573,401 people shows a substantial positive correlation between the proportion of South American Indians and percentage of population with at least kindergarten education in the United States with a correlation coefficient (R) of 0.532 and weighted average of 97.8%. Similarly, the statistical analysis conducted on geographies consisting of 512,259,139 people shows a poor positive correlation between the proportion of Russians and percentage of population with at least kindergarten education in the United States with a correlation coefficient (R) of 0.126 and weighted average of 98.4%, a difference of 0.62%.
South American Indian vs Russian Kindergarten

Kindergarten Correlation Summary

MeasurementSouth American IndianRussian
Minimum96.9%91.7%
Maximum100.0%100.0%
Range3.1%8.3%
Mean99.0%99.0%
Median99.2%99.6%
Interquartile 25% (IQ1)98.3%98.8%
Interquartile 75% (IQ3)100.0%100.0%
Interquartile Range (IQR)1.7%1.2%
Standard Deviation (Sample)0.94%1.7%
Standard Deviation (Population)0.93%1.7%

Similar Demographics by Kindergarten

Demographics Similar to South American Indians by Kindergarten

In terms of kindergarten, the demographic groups most similar to South American Indians are Uruguayan (97.8%, a difference of 0.0%), Immigrants from Bahamas (97.8%, a difference of 0.0%), Moroccan (97.8%, a difference of 0.010%), Samoan (97.8%, a difference of 0.010%), and Bahamian (97.8%, a difference of 0.010%).
DemographicsRating | RankKindergarten
Immigrants | Albania
16.4
/100
|
#206
Poor
97.8%
Africans
16.1
/100
|
#207
Poor
97.8%
Immigrants | Northern Africa
12.0
/100
|
#208
Poor
97.8%
Costa Ricans
11.6
/100
|
#209
Poor
97.8%
Immigrants | Oceania
11.1
/100
|
#210
Poor
97.8%
Laotians
10.5
/100
|
#211
Poor
97.8%
Moroccans
8.9
/100
|
#212
Tragic
97.8%
South American Indians
7.7
/100
|
#213
Tragic
97.8%
Uruguayans
7.5
/100
|
#214
Tragic
97.8%
Immigrants | Bahamas
7.4
/100
|
#215
Tragic
97.8%
Samoans
6.9
/100
|
#216
Tragic
97.8%
Bahamians
6.6
/100
|
#217
Tragic
97.8%
Immigrants | Morocco
5.4
/100
|
#218
Tragic
97.7%
Immigrants | Panama
5.0
/100
|
#219
Tragic
97.7%
Tongans
4.8
/100
|
#220
Tragic
97.7%

Demographics Similar to Russians by Kindergarten

In terms of kindergarten, the demographic groups most similar to Russians are Immigrants from Northern Europe (98.4%, a difference of 0.0%), Immigrants from Austria (98.4%, a difference of 0.0%), Chickasaw (98.4%, a difference of 0.0%), Serbian (98.4%, a difference of 0.0%), and Cheyenne (98.4%, a difference of 0.010%).
DemographicsRating | RankKindergarten
Immigrants | North America
99.7
/100
|
#63
Exceptional
98.4%
Greeks
99.7
/100
|
#64
Exceptional
98.4%
Maltese
99.7
/100
|
#65
Exceptional
98.4%
Cheyenne
99.6
/100
|
#66
Exceptional
98.4%
Canadians
99.6
/100
|
#67
Exceptional
98.4%
Immigrants | Northern Europe
99.6
/100
|
#68
Exceptional
98.4%
Immigrants | Austria
99.6
/100
|
#69
Exceptional
98.4%
Russians
99.6
/100
|
#70
Exceptional
98.4%
Chickasaw
99.6
/100
|
#71
Exceptional
98.4%
Serbians
99.6
/100
|
#72
Exceptional
98.4%
Cajuns
99.4
/100
|
#73
Exceptional
98.3%
Immigrants | Netherlands
99.3
/100
|
#74
Exceptional
98.3%
Cherokee
99.3
/100
|
#75
Exceptional
98.3%
Immigrants | England
99.3
/100
|
#76
Exceptional
98.3%
Delaware
99.3
/100
|
#77
Exceptional
98.3%