South American Indian vs Portuguese 7th Grade
COMPARE
South American Indian
Portuguese
7th Grade
7th Grade Comparison
South American Indians
Portuguese
95.5%
7TH GRADE
2.0/ 100
METRIC RATING
241st/ 347
METRIC RANK
95.8%
7TH GRADE
13.6/ 100
METRIC RATING
211th/ 347
METRIC RANK
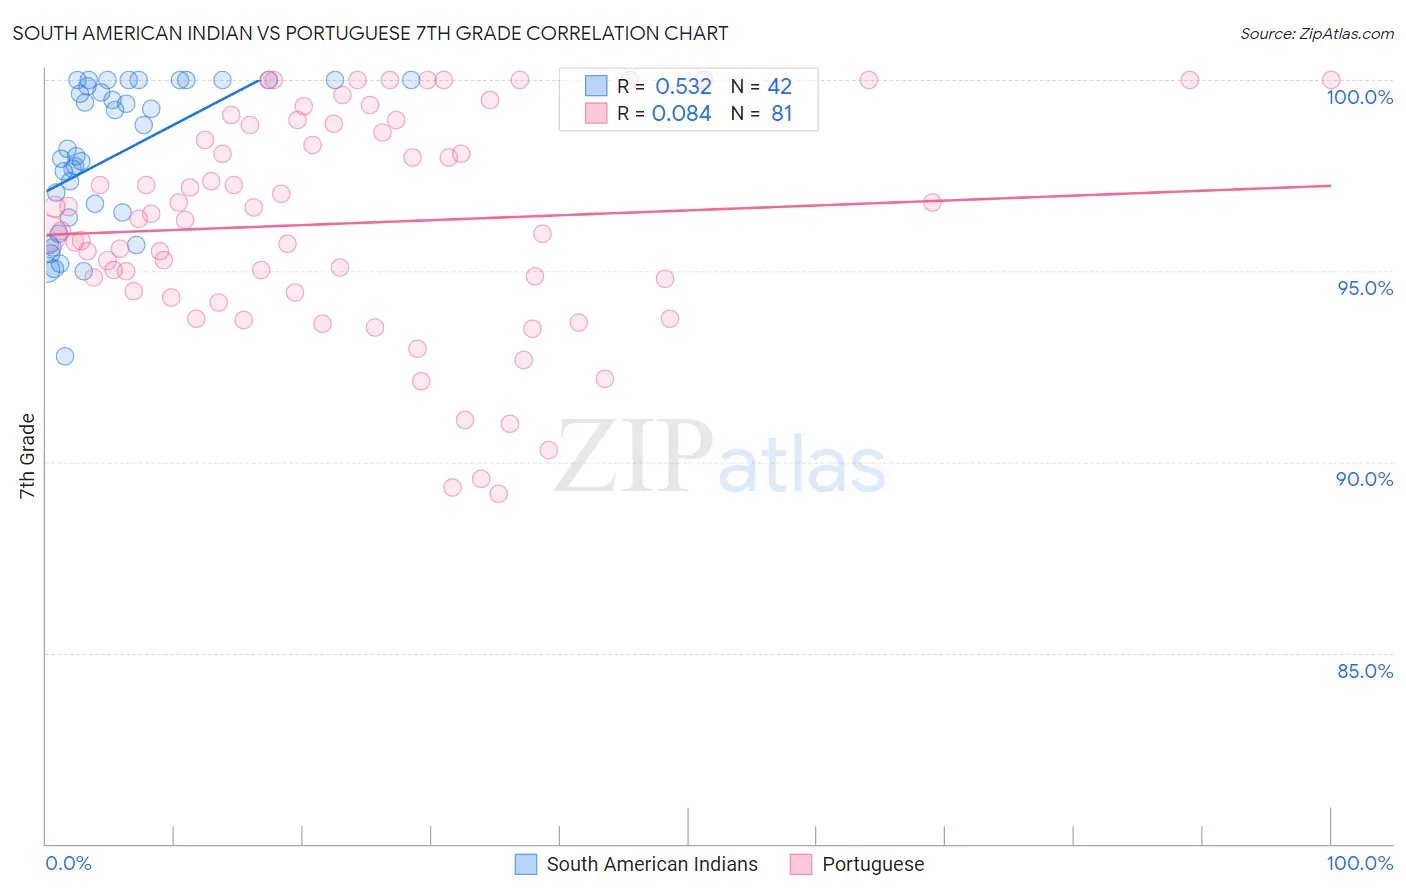
South American Indian vs Portuguese 7th Grade Correlation Chart
The statistical analysis conducted on geographies consisting of 164,571,317 people shows a substantial positive correlation between the proportion of South American Indians and percentage of population with at least 7th grade education in the United States with a correlation coefficient (R) of 0.532 and weighted average of 95.5%. Similarly, the statistical analysis conducted on geographies consisting of 450,343,001 people shows a slight positive correlation between the proportion of Portuguese and percentage of population with at least 7th grade education in the United States with a correlation coefficient (R) of 0.084 and weighted average of 95.8%, a difference of 0.32%.
7th Grade Correlation Summary
| Measurement | South American Indian | Portuguese |
| Minimum | 92.8% | 89.2% |
| Maximum | 100.0% | 100.0% |
| Range | 7.2% | 10.8% |
| Mean | 98.0% | 96.3% |
| Median | 98.1% | 96.4% |
| Interquartile 25% (IQ1) | 96.4% | 94.5% |
| Interquartile 75% (IQ3) | 100.0% | 98.8% |
| Interquartile Range (IQR) | 3.6% | 4.4% |
| Standard Deviation (Sample) | 2.0% | 2.8% |
| Standard Deviation (Population) | 1.9% | 2.8% |
Similar Demographics by 7th Grade
Demographics Similar to South American Indians by 7th Grade
In terms of 7th grade, the demographic groups most similar to South American Indians are Immigrants from Sierra Leone (95.5%, a difference of 0.0%), Immigrants from Senegal (95.5%, a difference of 0.0%), Indian (Asian) (95.5%, a difference of 0.020%), Jamaican (95.5%, a difference of 0.020%), and Immigrants from Asia (95.5%, a difference of 0.030%).
| Demographics | Rating | Rank | 7th Grade |
| Nigerians | 3.0 /100 | #234 | Tragic 95.5% |
| Immigrants | Africa | 2.7 /100 | #235 | Tragic 95.5% |
| Asians | 2.6 /100 | #236 | Tragic 95.5% |
| Immigrants | Asia | 2.3 /100 | #237 | Tragic 95.5% |
| Indians (Asian) | 2.3 /100 | #238 | Tragic 95.5% |
| Jamaicans | 2.2 /100 | #239 | Tragic 95.5% |
| Immigrants | Sierra Leone | 2.0 /100 | #240 | Tragic 95.5% |
| South American Indians | 2.0 /100 | #241 | Tragic 95.5% |
| Immigrants | Senegal | 1.9 /100 | #242 | Tragic 95.5% |
| U.S. Virgin Islanders | 1.6 /100 | #243 | Tragic 95.4% |
| Uruguayans | 1.6 /100 | #244 | Tragic 95.4% |
| Immigrants | Middle Africa | 1.5 /100 | #245 | Tragic 95.4% |
| Ethiopians | 1.5 /100 | #246 | Tragic 95.4% |
| Tongans | 1.3 /100 | #247 | Tragic 95.4% |
| Paiute | 1.2 /100 | #248 | Tragic 95.4% |
Demographics Similar to Portuguese by 7th Grade
In terms of 7th grade, the demographic groups most similar to Portuguese are Immigrants from Lebanon (95.8%, a difference of 0.010%), Immigrants from Morocco (95.8%, a difference of 0.010%), Dutch West Indian (95.8%, a difference of 0.030%), Hawaiian (95.8%, a difference of 0.030%), and Bahamian (95.7%, a difference of 0.030%).
| Demographics | Rating | Rank | 7th Grade |
| Assyrians/Chaldeans/Syriacs | 20.5 /100 | #204 | Fair 95.8% |
| Moroccans | 18.9 /100 | #205 | Poor 95.8% |
| Africans | 17.6 /100 | #206 | Poor 95.8% |
| Navajo | 17.0 /100 | #207 | Poor 95.8% |
| Immigrants | Sudan | 17.0 /100 | #208 | Poor 95.8% |
| Dutch West Indians | 16.1 /100 | #209 | Poor 95.8% |
| Hawaiians | 16.0 /100 | #210 | Poor 95.8% |
| Portuguese | 13.6 /100 | #211 | Poor 95.8% |
| Immigrants | Lebanon | 13.0 /100 | #212 | Poor 95.8% |
| Immigrants | Morocco | 12.6 /100 | #213 | Poor 95.8% |
| Bahamians | 11.6 /100 | #214 | Poor 95.7% |
| Spanish Americans | 9.3 /100 | #215 | Tragic 95.7% |
| Immigrants | Chile | 9.1 /100 | #216 | Tragic 95.7% |
| Immigrants | Pakistan | 9.0 /100 | #217 | Tragic 95.7% |
| Immigrants | Liberia | 8.1 /100 | #218 | Tragic 95.7% |