South African vs Tlingit-Haida 1st Grade
COMPARE
South African
Tlingit-Haida
1st Grade
1st Grade Comparison
South Africans
Tlingit-Haida
98.2%
1ST GRADE
98.6/ 100
METRIC RATING
94th/ 347
METRIC RANK
98.7%
1ST GRADE
100.0/ 100
METRIC RATING
11th/ 347
METRIC RANK
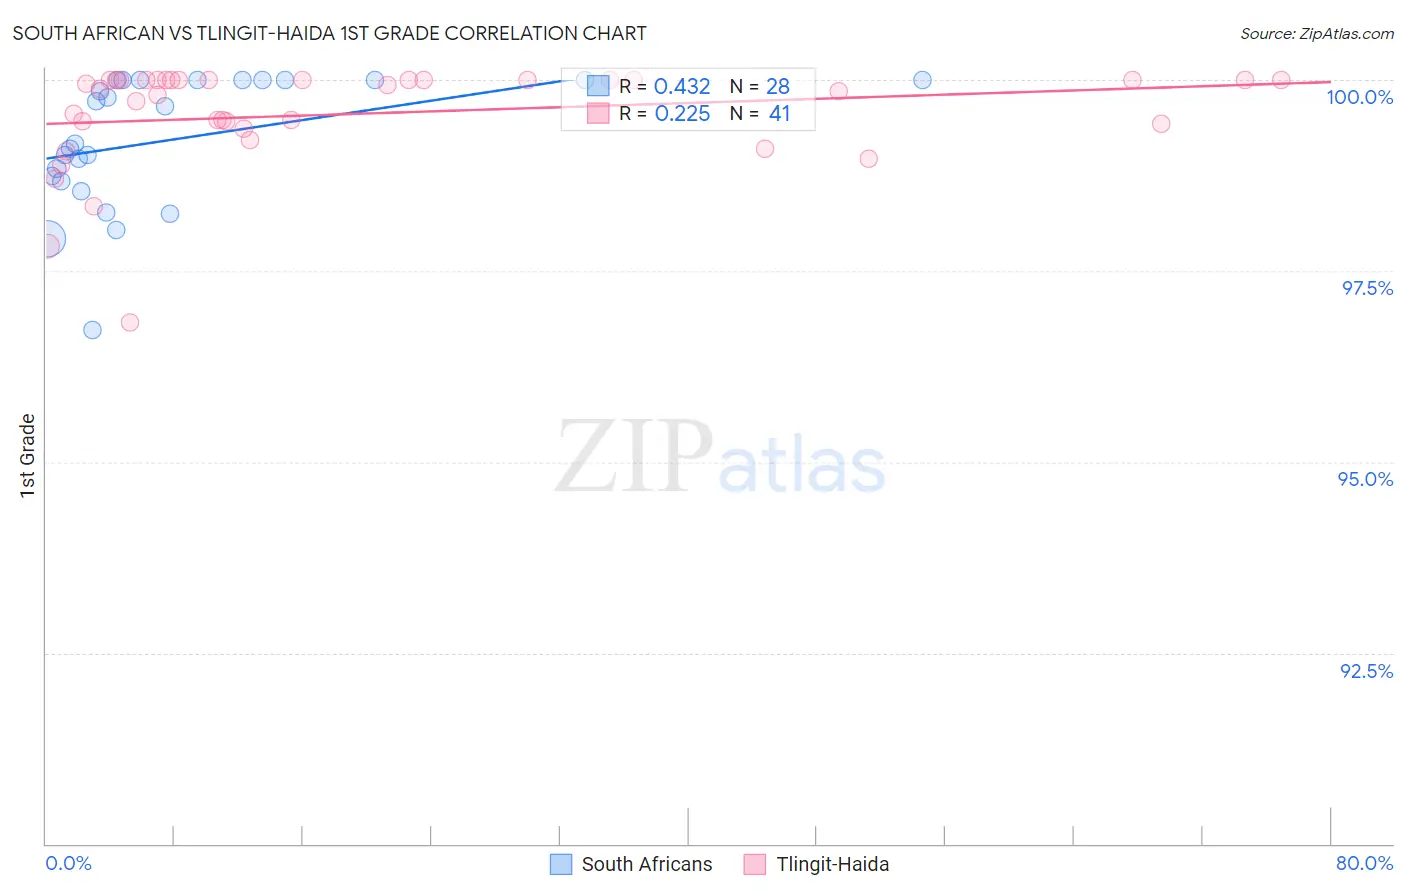
South African vs Tlingit-Haida 1st Grade Correlation Chart
The statistical analysis conducted on geographies consisting of 182,602,894 people shows a moderate positive correlation between the proportion of South Africans and percentage of population with at least 1st grade education in the United States with a correlation coefficient (R) of 0.432 and weighted average of 98.2%. Similarly, the statistical analysis conducted on geographies consisting of 60,865,648 people shows a weak positive correlation between the proportion of Tlingit-Haida and percentage of population with at least 1st grade education in the United States with a correlation coefficient (R) of 0.225 and weighted average of 98.7%, a difference of 0.44%.
1st Grade Correlation Summary
| Measurement | South African | Tlingit-Haida |
| Minimum | 96.7% | 96.8% |
| Maximum | 100.0% | 100.0% |
| Range | 3.3% | 3.2% |
| Mean | 99.2% | 99.6% |
| Median | 99.4% | 99.9% |
| Interquartile 25% (IQ1) | 98.7% | 99.4% |
| Interquartile 75% (IQ3) | 100.0% | 100.0% |
| Interquartile Range (IQR) | 1.3% | 0.60% |
| Standard Deviation (Sample) | 0.85% | 0.67% |
| Standard Deviation (Population) | 0.84% | 0.67% |
Similar Demographics by 1st Grade
Demographics Similar to South Africans by 1st Grade
In terms of 1st grade, the demographic groups most similar to South Africans are Immigrants from India (98.2%, a difference of 0.0%), Immigrants from Germany (98.2%, a difference of 0.0%), Immigrants from Western Europe (98.3%, a difference of 0.010%), Macedonian (98.3%, a difference of 0.010%), and Cypriot (98.2%, a difference of 0.010%).
| Demographics | Rating | Rank | 1st Grade |
| Immigrants | Australia | 99.0 /100 | #87 | Exceptional 98.3% |
| Zimbabweans | 98.9 /100 | #88 | Exceptional 98.3% |
| Immigrants | South Africa | 98.8 /100 | #89 | Exceptional 98.3% |
| Ukrainians | 98.8 /100 | #90 | Exceptional 98.3% |
| Immigrants | Western Europe | 98.8 /100 | #91 | Exceptional 98.3% |
| Macedonians | 98.7 /100 | #92 | Exceptional 98.3% |
| Immigrants | India | 98.6 /100 | #93 | Exceptional 98.2% |
| South Africans | 98.6 /100 | #94 | Exceptional 98.2% |
| Immigrants | Germany | 98.5 /100 | #95 | Exceptional 98.2% |
| Cypriots | 98.3 /100 | #96 | Exceptional 98.2% |
| Immigrants | Nonimmigrants | 98.3 /100 | #97 | Exceptional 98.2% |
| Choctaw | 98.3 /100 | #98 | Exceptional 98.2% |
| Puget Sound Salish | 98.2 /100 | #99 | Exceptional 98.2% |
| Colville | 98.0 /100 | #100 | Exceptional 98.2% |
| Romanians | 97.8 /100 | #101 | Exceptional 98.2% |
Demographics Similar to Tlingit-Haida by 1st Grade
In terms of 1st grade, the demographic groups most similar to Tlingit-Haida are German (98.7%, a difference of 0.010%), Slovene (98.7%, a difference of 0.010%), Slovak (98.7%, a difference of 0.020%), Carpatho Rusyn (98.6%, a difference of 0.020%), and English (98.6%, a difference of 0.020%).
| Demographics | Rating | Rank | 1st Grade |
| Welsh | 100.0 /100 | #4 | Exceptional 98.9% |
| Tsimshian | 100.0 /100 | #5 | Exceptional 98.8% |
| Alaskan Athabascans | 100.0 /100 | #6 | Exceptional 98.8% |
| Alaska Natives | 100.0 /100 | #7 | Exceptional 98.7% |
| Norwegians | 100.0 /100 | #8 | Exceptional 98.7% |
| Slovaks | 100.0 /100 | #9 | Exceptional 98.7% |
| Germans | 100.0 /100 | #10 | Exceptional 98.7% |
| Tlingit-Haida | 100.0 /100 | #11 | Exceptional 98.7% |
| Slovenes | 100.0 /100 | #12 | Exceptional 98.7% |
| Carpatho Rusyns | 100.0 /100 | #13 | Exceptional 98.6% |
| English | 100.0 /100 | #14 | Exceptional 98.6% |
| Swedes | 100.0 /100 | #15 | Exceptional 98.6% |
| Aleuts | 100.0 /100 | #16 | Exceptional 98.6% |
| Scottish | 100.0 /100 | #17 | Exceptional 98.6% |
| Dutch | 100.0 /100 | #18 | Exceptional 98.6% |