Somali vs Immigrants from Peru 2nd Grade
COMPARE
Somali
Immigrants from Peru
2nd Grade
2nd Grade Comparison
Somalis
Immigrants from Peru
97.0%
2ND GRADE
0.0/ 100
METRIC RATING
302nd/ 347
METRIC RANK
97.4%
2ND GRADE
0.1/ 100
METRIC RATING
272nd/ 347
METRIC RANK
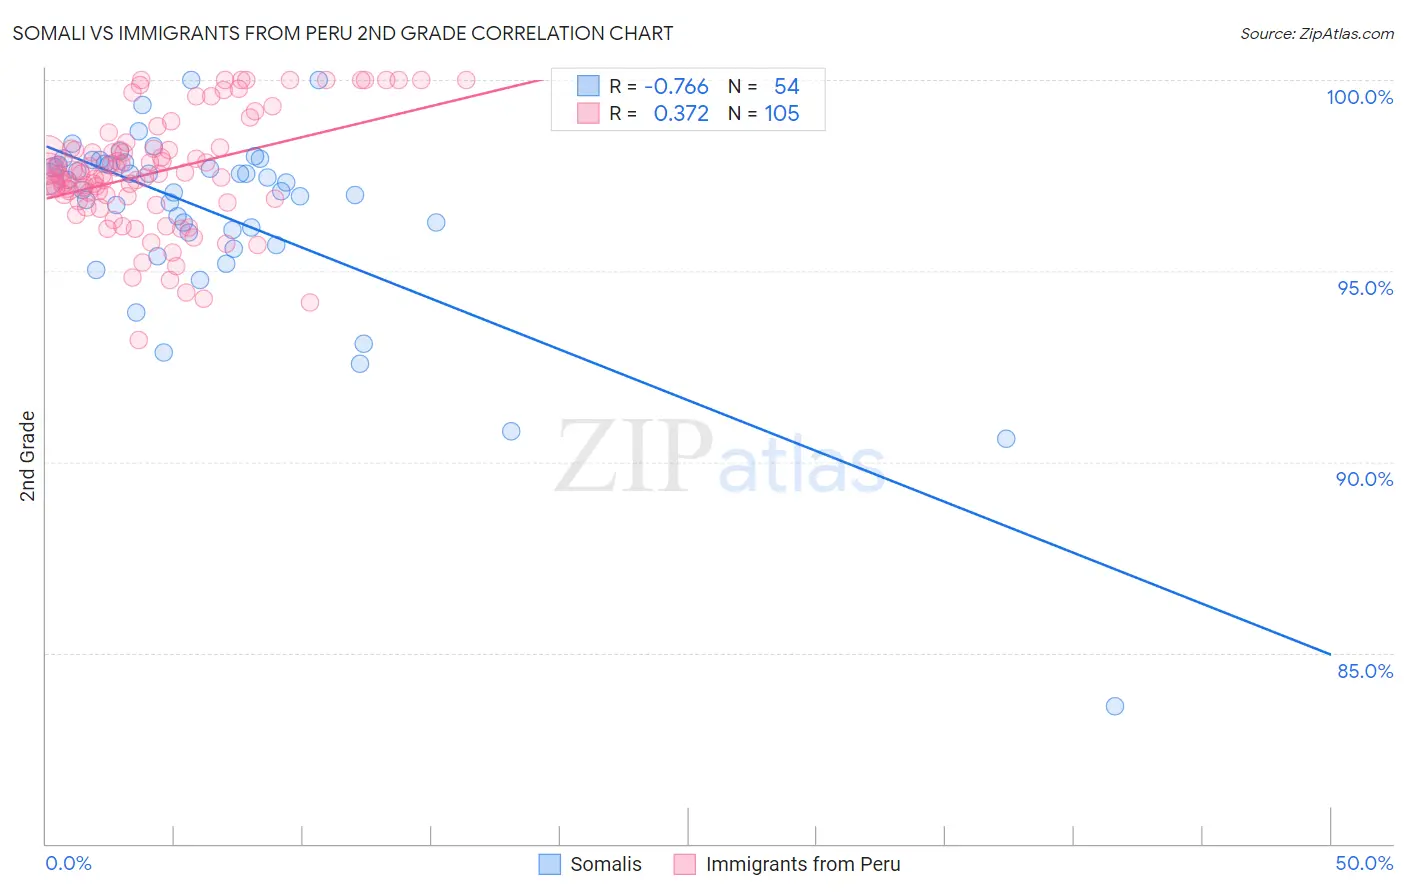
Somali vs Immigrants from Peru 2nd Grade Correlation Chart
The statistical analysis conducted on geographies consisting of 99,332,457 people shows a strong negative correlation between the proportion of Somalis and percentage of population with at least 2nd grade education in the United States with a correlation coefficient (R) of -0.766 and weighted average of 97.0%. Similarly, the statistical analysis conducted on geographies consisting of 328,685,754 people shows a mild positive correlation between the proportion of Immigrants from Peru and percentage of population with at least 2nd grade education in the United States with a correlation coefficient (R) of 0.372 and weighted average of 97.4%, a difference of 0.42%.
2nd Grade Correlation Summary
| Measurement | Somali | Immigrants from Peru |
| Minimum | 83.6% | 93.2% |
| Maximum | 100.0% | 100.0% |
| Range | 16.4% | 6.8% |
| Mean | 96.4% | 97.6% |
| Median | 97.2% | 97.5% |
| Interquartile 25% (IQ1) | 96.0% | 96.9% |
| Interquartile 75% (IQ3) | 97.8% | 98.2% |
| Interquartile Range (IQR) | 1.8% | 1.3% |
| Standard Deviation (Sample) | 2.6% | 1.5% |
| Standard Deviation (Population) | 2.6% | 1.5% |
Similar Demographics by 2nd Grade
Demographics Similar to Somalis by 2nd Grade
In terms of 2nd grade, the demographic groups most similar to Somalis are Central American Indian (97.0%, a difference of 0.020%), Immigrants from South Eastern Asia (97.0%, a difference of 0.040%), Ecuadorian (96.9%, a difference of 0.040%), Immigrants from Caribbean (96.9%, a difference of 0.050%), and Immigrants from Cuba (97.0%, a difference of 0.060%).
| Demographics | Rating | Rank | 2nd Grade |
| Immigrants | Grenada | 0.0 /100 | #295 | Tragic 97.1% |
| Immigrants | Immigrants | 0.0 /100 | #296 | Tragic 97.1% |
| Immigrants | Cuba | 0.0 /100 | #297 | Tragic 97.0% |
| Immigrants | Dominica | 0.0 /100 | #298 | Tragic 97.0% |
| Haitians | 0.0 /100 | #299 | Tragic 97.0% |
| Immigrants | South Eastern Asia | 0.0 /100 | #300 | Tragic 97.0% |
| Central American Indians | 0.0 /100 | #301 | Tragic 97.0% |
| Somalis | 0.0 /100 | #302 | Tragic 97.0% |
| Ecuadorians | 0.0 /100 | #303 | Tragic 96.9% |
| Immigrants | Caribbean | 0.0 /100 | #304 | Tragic 96.9% |
| Nicaraguans | 0.0 /100 | #305 | Tragic 96.9% |
| Immigrants | Somalia | 0.0 /100 | #306 | Tragic 96.9% |
| Immigrants | Azores | 0.0 /100 | #307 | Tragic 96.8% |
| Immigrants | Haiti | 0.0 /100 | #308 | Tragic 96.8% |
| Belizeans | 0.0 /100 | #309 | Tragic 96.8% |
Demographics Similar to Immigrants from Peru by 2nd Grade
In terms of 2nd grade, the demographic groups most similar to Immigrants from Peru are Immigrants from Cameroon (97.4%, a difference of 0.010%), Immigrants from Bolivia (97.4%, a difference of 0.010%), Ghanaian (97.4%, a difference of 0.020%), Immigrants from China (97.3%, a difference of 0.020%), and Immigrants from Jamaica (97.4%, a difference of 0.030%).
| Demographics | Rating | Rank | 2nd Grade |
| Immigrants | South America | 0.4 /100 | #265 | Tragic 97.4% |
| Immigrants | Sierra Leone | 0.4 /100 | #266 | Tragic 97.4% |
| Cubans | 0.3 /100 | #267 | Tragic 97.4% |
| Immigrants | Nigeria | 0.3 /100 | #268 | Tragic 97.4% |
| West Indians | 0.3 /100 | #269 | Tragic 97.4% |
| Immigrants | Jamaica | 0.2 /100 | #270 | Tragic 97.4% |
| Immigrants | Cameroon | 0.2 /100 | #271 | Tragic 97.4% |
| Immigrants | Peru | 0.1 /100 | #272 | Tragic 97.4% |
| Immigrants | Bolivia | 0.1 /100 | #273 | Tragic 97.4% |
| Ghanaians | 0.1 /100 | #274 | Tragic 97.4% |
| Immigrants | China | 0.1 /100 | #275 | Tragic 97.3% |
| Immigrants | Philippines | 0.1 /100 | #276 | Tragic 97.3% |
| Immigrants | Western Africa | 0.1 /100 | #277 | Tragic 97.3% |
| Immigrants | Uzbekistan | 0.1 /100 | #278 | Tragic 97.3% |
| Immigrants | Ghana | 0.1 /100 | #279 | Tragic 97.3% |