Slovene vs Greek 10th Grade
COMPARE
Slovene
Greek
10th Grade
10th Grade Comparison
Slovenes
Greeks
95.9%
10TH GRADE
100.0/ 100
METRIC RATING
3rd/ 347
METRIC RANK
95.2%
10TH GRADE
99.9/ 100
METRIC RATING
45th/ 347
METRIC RANK
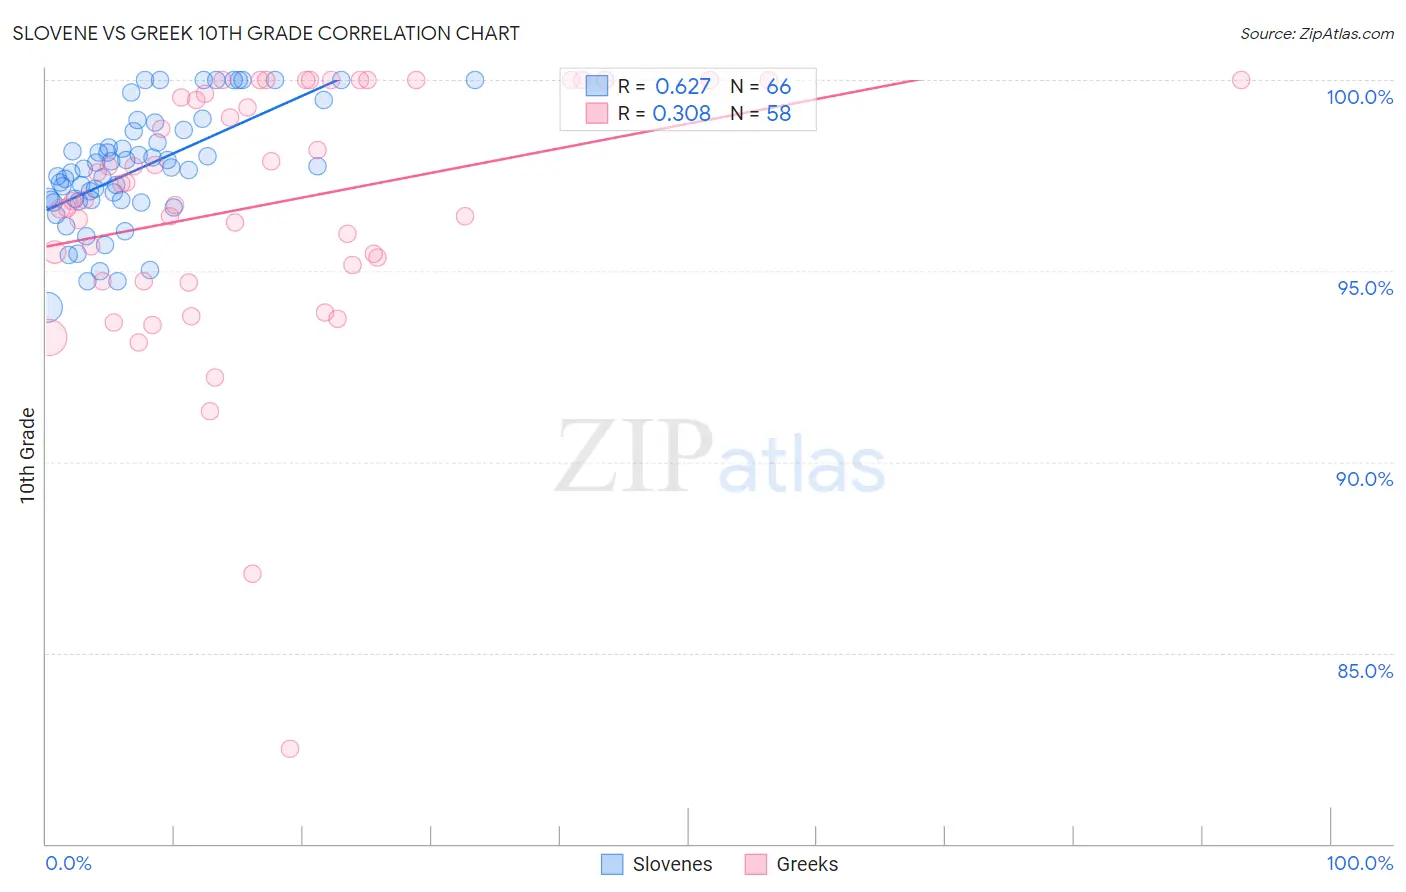
Slovene vs Greek 10th Grade Correlation Chart
The statistical analysis conducted on geographies consisting of 261,353,374 people shows a significant positive correlation between the proportion of Slovenes and percentage of population with at least 10th grade education in the United States with a correlation coefficient (R) of 0.627 and weighted average of 95.9%. Similarly, the statistical analysis conducted on geographies consisting of 482,775,358 people shows a mild positive correlation between the proportion of Greeks and percentage of population with at least 10th grade education in the United States with a correlation coefficient (R) of 0.308 and weighted average of 95.2%, a difference of 0.83%.
10th Grade Correlation Summary
| Measurement | Slovene | Greek |
| Minimum | 94.0% | 82.5% |
| Maximum | 100.0% | 100.0% |
| Range | 6.0% | 17.5% |
| Mean | 97.7% | 96.8% |
| Median | 97.7% | 97.1% |
| Interquartile 25% (IQ1) | 96.8% | 95.2% |
| Interquartile 75% (IQ3) | 98.7% | 100.0% |
| Interquartile Range (IQR) | 1.8% | 4.8% |
| Standard Deviation (Sample) | 1.5% | 3.4% |
| Standard Deviation (Population) | 1.5% | 3.3% |
Similar Demographics by 10th Grade
Demographics Similar to Slovenes by 10th Grade
In terms of 10th grade, the demographic groups most similar to Slovenes are Swedish (95.9%, a difference of 0.0%), Carpatho Rusyn (95.9%, a difference of 0.020%), Slovak (96.0%, a difference of 0.10%), Polish (95.8%, a difference of 0.12%), and German (95.8%, a difference of 0.13%).
| Demographics | Rating | Rank | 10th Grade |
| Norwegians | 100.0 /100 | #1 | Exceptional 96.2% |
| Slovaks | 100.0 /100 | #2 | Exceptional 96.0% |
| Slovenes | 100.0 /100 | #3 | Exceptional 95.9% |
| Swedes | 100.0 /100 | #4 | Exceptional 95.9% |
| Carpatho Rusyns | 100.0 /100 | #5 | Exceptional 95.9% |
| Poles | 100.0 /100 | #6 | Exceptional 95.8% |
| Germans | 100.0 /100 | #7 | Exceptional 95.8% |
| Lithuanians | 100.0 /100 | #8 | Exceptional 95.8% |
| Finns | 100.0 /100 | #9 | Exceptional 95.8% |
| Croatians | 100.0 /100 | #10 | Exceptional 95.7% |
| Danes | 100.0 /100 | #11 | Exceptional 95.7% |
| Tlingit-Haida | 100.0 /100 | #12 | Exceptional 95.7% |
| English | 100.0 /100 | #13 | Exceptional 95.6% |
| Tsimshian | 100.0 /100 | #14 | Exceptional 95.6% |
| Irish | 100.0 /100 | #15 | Exceptional 95.6% |
Demographics Similar to Greeks by 10th Grade
In terms of 10th grade, the demographic groups most similar to Greeks are Immigrants from Northern Europe (95.2%, a difference of 0.0%), Macedonian (95.2%, a difference of 0.010%), Czechoslovakian (95.1%, a difference of 0.010%), Serbian (95.1%, a difference of 0.020%), and Slavic (95.2%, a difference of 0.030%).
| Demographics | Rating | Rank | 10th Grade |
| Northern Europeans | 99.9 /100 | #38 | Exceptional 95.3% |
| Immigrants | Scotland | 99.9 /100 | #39 | Exceptional 95.2% |
| Scotch-Irish | 99.9 /100 | #40 | Exceptional 95.2% |
| Russians | 99.9 /100 | #41 | Exceptional 95.2% |
| Slavs | 99.9 /100 | #42 | Exceptional 95.2% |
| Macedonians | 99.9 /100 | #43 | Exceptional 95.2% |
| Immigrants | Northern Europe | 99.9 /100 | #44 | Exceptional 95.2% |
| Greeks | 99.9 /100 | #45 | Exceptional 95.2% |
| Czechoslovakians | 99.9 /100 | #46 | Exceptional 95.1% |
| Serbians | 99.9 /100 | #47 | Exceptional 95.1% |
| Australians | 99.9 /100 | #48 | Exceptional 95.1% |
| Immigrants | Austria | 99.9 /100 | #49 | Exceptional 95.1% |
| Immigrants | Canada | 99.8 /100 | #50 | Exceptional 95.1% |
| Austrians | 99.8 /100 | #51 | Exceptional 95.1% |
| Ottawa | 99.8 /100 | #52 | Exceptional 95.1% |