Slavic vs Immigrants from South Africa 10th Grade
COMPARE
Slavic
Immigrants from South Africa
10th Grade
10th Grade Comparison
Slavs
Immigrants from South Africa
95.2%
10TH GRADE
99.9/ 100
METRIC RATING
42nd/ 347
METRIC RANK
94.8%
10TH GRADE
99.5/ 100
METRIC RATING
77th/ 347
METRIC RANK
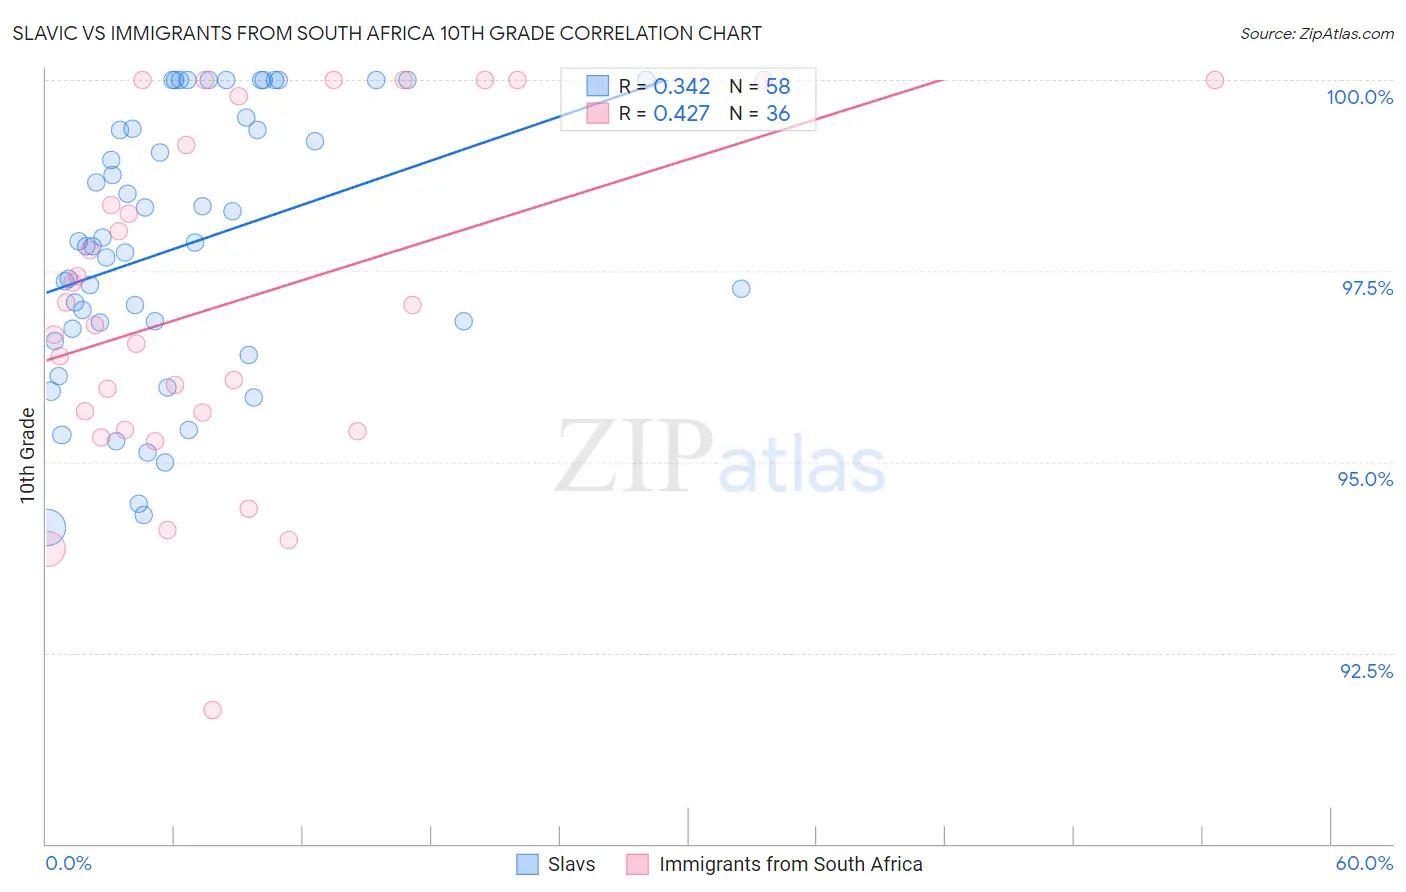
Slavic vs Immigrants from South Africa 10th Grade Correlation Chart
The statistical analysis conducted on geographies consisting of 270,868,154 people shows a mild positive correlation between the proportion of Slavs and percentage of population with at least 10th grade education in the United States with a correlation coefficient (R) of 0.342 and weighted average of 95.2%. Similarly, the statistical analysis conducted on geographies consisting of 233,321,693 people shows a moderate positive correlation between the proportion of Immigrants from South Africa and percentage of population with at least 10th grade education in the United States with a correlation coefficient (R) of 0.427 and weighted average of 94.8%, a difference of 0.37%.
10th Grade Correlation Summary
| Measurement | Slavic | Immigrants from South Africa |
| Minimum | 94.1% | 91.8% |
| Maximum | 100.0% | 100.0% |
| Range | 5.9% | 8.2% |
| Mean | 97.8% | 97.1% |
| Median | 97.9% | 96.9% |
| Interquartile 25% (IQ1) | 96.8% | 95.5% |
| Interquartile 75% (IQ3) | 99.4% | 99.5% |
| Interquartile Range (IQR) | 2.6% | 3.9% |
| Standard Deviation (Sample) | 1.7% | 2.2% |
| Standard Deviation (Population) | 1.7% | 2.2% |
Similar Demographics by 10th Grade
Demographics Similar to Slavs by 10th Grade
In terms of 10th grade, the demographic groups most similar to Slavs are Macedonian (95.2%, a difference of 0.020%), Russian (95.2%, a difference of 0.030%), Immigrants from Northern Europe (95.2%, a difference of 0.030%), Greek (95.2%, a difference of 0.030%), and Czechoslovakian (95.1%, a difference of 0.040%).
| Demographics | Rating | Rank | 10th Grade |
| Estonians | 99.9 /100 | #35 | Exceptional 95.3% |
| Immigrants | India | 99.9 /100 | #36 | Exceptional 95.3% |
| French Canadians | 99.9 /100 | #37 | Exceptional 95.3% |
| Northern Europeans | 99.9 /100 | #38 | Exceptional 95.3% |
| Immigrants | Scotland | 99.9 /100 | #39 | Exceptional 95.2% |
| Scotch-Irish | 99.9 /100 | #40 | Exceptional 95.2% |
| Russians | 99.9 /100 | #41 | Exceptional 95.2% |
| Slavs | 99.9 /100 | #42 | Exceptional 95.2% |
| Macedonians | 99.9 /100 | #43 | Exceptional 95.2% |
| Immigrants | Northern Europe | 99.9 /100 | #44 | Exceptional 95.2% |
| Greeks | 99.9 /100 | #45 | Exceptional 95.2% |
| Czechoslovakians | 99.9 /100 | #46 | Exceptional 95.1% |
| Serbians | 99.9 /100 | #47 | Exceptional 95.1% |
| Australians | 99.9 /100 | #48 | Exceptional 95.1% |
| Immigrants | Austria | 99.9 /100 | #49 | Exceptional 95.1% |
Demographics Similar to Immigrants from South Africa by 10th Grade
In terms of 10th grade, the demographic groups most similar to Immigrants from South Africa are Romanian (94.8%, a difference of 0.0%), Okinawan (94.8%, a difference of 0.010%), Bhutanese (94.9%, a difference of 0.040%), Canadian (94.9%, a difference of 0.040%), and Immigrants from Sweden (94.9%, a difference of 0.050%).
| Demographics | Rating | Rank | 10th Grade |
| Zimbabweans | 99.6 /100 | #70 | Exceptional 94.9% |
| Alaska Natives | 99.6 /100 | #71 | Exceptional 94.9% |
| Immigrants | Sweden | 99.6 /100 | #72 | Exceptional 94.9% |
| Bhutanese | 99.6 /100 | #73 | Exceptional 94.9% |
| Canadians | 99.6 /100 | #74 | Exceptional 94.9% |
| Okinawans | 99.5 /100 | #75 | Exceptional 94.8% |
| Romanians | 99.5 /100 | #76 | Exceptional 94.8% |
| Immigrants | South Africa | 99.5 /100 | #77 | Exceptional 94.8% |
| Filipinos | 99.3 /100 | #78 | Exceptional 94.8% |
| Immigrants | Czechoslovakia | 99.2 /100 | #79 | Exceptional 94.7% |
| Immigrants | Denmark | 99.2 /100 | #80 | Exceptional 94.7% |
| Immigrants | Latvia | 99.2 /100 | #81 | Exceptional 94.7% |
| Swiss | 99.1 /100 | #82 | Exceptional 94.7% |
| Immigrants | Western Europe | 99.1 /100 | #83 | Exceptional 94.7% |
| Icelanders | 99.1 /100 | #84 | Exceptional 94.7% |