Sierra Leonean vs Seminole Kindergarten
COMPARE
Sierra Leonean
Seminole
Kindergarten
Kindergarten Comparison
Sierra Leoneans
Seminole
97.7%
KINDERGARTEN
3.4/ 100
METRIC RATING
229th/ 347
METRIC RANK
98.1%
KINDERGARTEN
91.5/ 100
METRIC RATING
129th/ 347
METRIC RANK
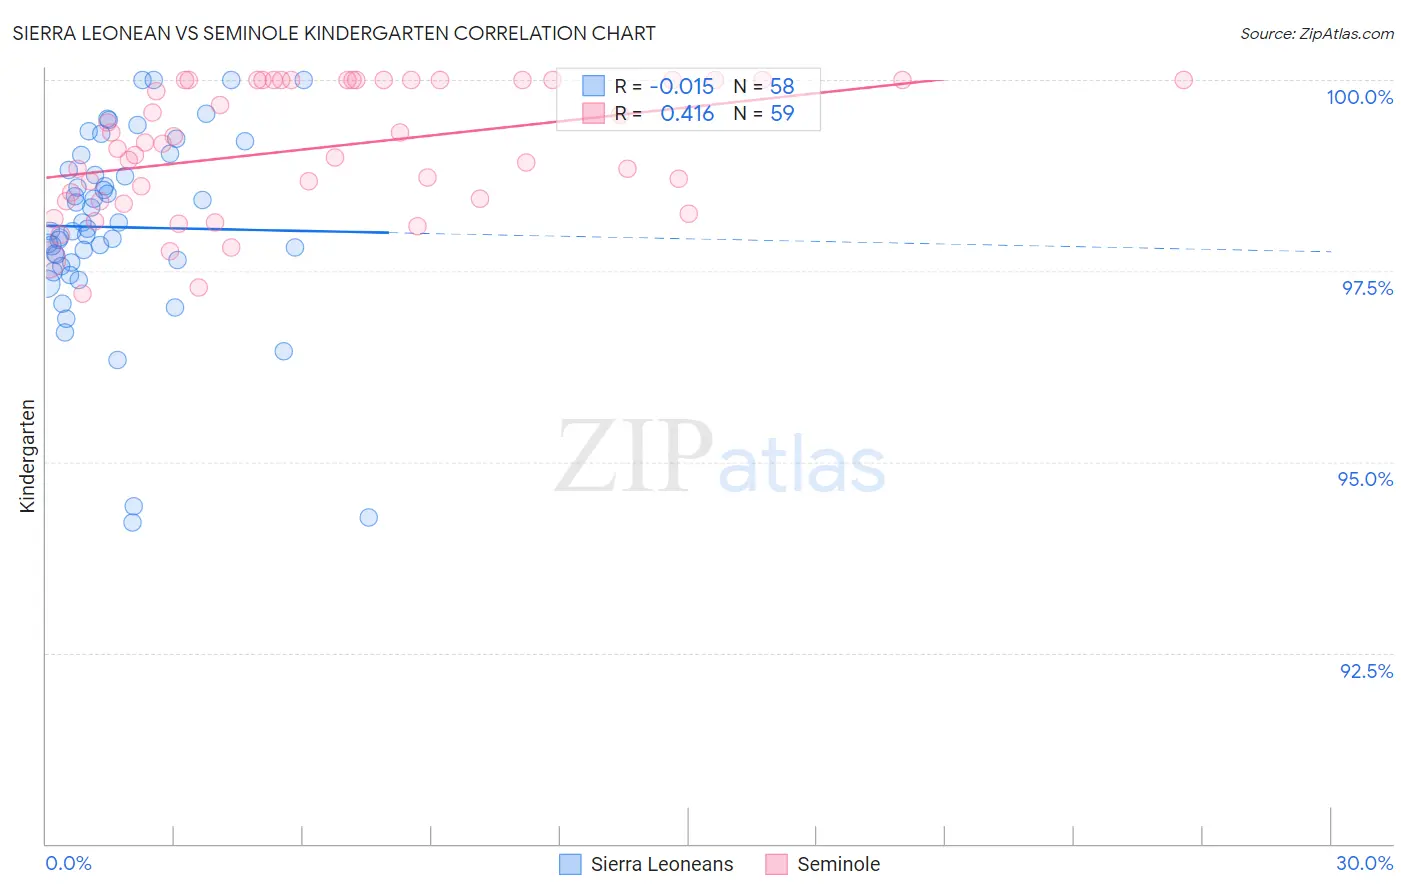
Sierra Leonean vs Seminole Kindergarten Correlation Chart
The statistical analysis conducted on geographies consisting of 83,337,655 people shows no correlation between the proportion of Sierra Leoneans and percentage of population with at least kindergarten education in the United States with a correlation coefficient (R) of -0.015 and weighted average of 97.7%. Similarly, the statistical analysis conducted on geographies consisting of 118,313,042 people shows a moderate positive correlation between the proportion of Seminole and percentage of population with at least kindergarten education in the United States with a correlation coefficient (R) of 0.416 and weighted average of 98.1%, a difference of 0.44%.
Kindergarten Correlation Summary
| Measurement | Sierra Leonean | Seminole |
| Minimum | 94.2% | 97.2% |
| Maximum | 100.0% | 100.0% |
| Range | 5.8% | 2.8% |
| Mean | 98.1% | 99.1% |
| Median | 98.0% | 99.2% |
| Interquartile 25% (IQ1) | 97.6% | 98.4% |
| Interquartile 75% (IQ3) | 98.8% | 100.0% |
| Interquartile Range (IQR) | 1.2% | 1.6% |
| Standard Deviation (Sample) | 1.3% | 0.83% |
| Standard Deviation (Population) | 1.2% | 0.83% |
Similar Demographics by Kindergarten
Demographics Similar to Sierra Leoneans by Kindergarten
In terms of kindergarten, the demographic groups most similar to Sierra Leoneans are Subsaharan African (97.7%, a difference of 0.0%), Senegalese (97.7%, a difference of 0.0%), Iraqi (97.7%, a difference of 0.010%), Immigrants from Nepal (97.7%, a difference of 0.010%), and Sudanese (97.7%, a difference of 0.010%).
| Demographics | Rating | Rank | Kindergarten |
| Immigrants | Sudan | 4.5 /100 | #222 | Tragic 97.7% |
| Immigrants | Syria | 4.3 /100 | #223 | Tragic 97.7% |
| Iraqis | 3.9 /100 | #224 | Tragic 97.7% |
| Immigrants | Nepal | 3.8 /100 | #225 | Tragic 97.7% |
| Sudanese | 3.7 /100 | #226 | Tragic 97.7% |
| Immigrants | Costa Rica | 3.6 /100 | #227 | Tragic 97.7% |
| Sub-Saharan Africans | 3.5 /100 | #228 | Tragic 97.7% |
| Sierra Leoneans | 3.4 /100 | #229 | Tragic 97.7% |
| Senegalese | 3.3 /100 | #230 | Tragic 97.7% |
| Puerto Ricans | 2.7 /100 | #231 | Tragic 97.7% |
| Immigrants | Uruguay | 2.6 /100 | #232 | Tragic 97.7% |
| Immigrants | Pakistan | 2.2 /100 | #233 | Tragic 97.7% |
| Immigrants | Malaysia | 2.2 /100 | #234 | Tragic 97.7% |
| Colombians | 2.2 /100 | #235 | Tragic 97.7% |
| Immigrants | Western Asia | 2.1 /100 | #236 | Tragic 97.7% |
Demographics Similar to Seminole by Kindergarten
In terms of kindergarten, the demographic groups most similar to Seminole are Immigrants from Croatia (98.1%, a difference of 0.0%), Cambodian (98.1%, a difference of 0.0%), Spaniard (98.1%, a difference of 0.0%), Immigrants from Serbia (98.1%, a difference of 0.010%), and Immigrants from Europe (98.1%, a difference of 0.010%).
| Demographics | Rating | Rank | Kindergarten |
| Immigrants | Japan | 94.0 /100 | #122 | Exceptional 98.2% |
| Menominee | 93.9 /100 | #123 | Exceptional 98.2% |
| Syrians | 93.6 /100 | #124 | Exceptional 98.2% |
| Iroquois | 93.5 /100 | #125 | Exceptional 98.2% |
| Lebanese | 93.5 /100 | #126 | Exceptional 98.2% |
| Immigrants | Saudi Arabia | 93.1 /100 | #127 | Exceptional 98.1% |
| Immigrants | Serbia | 92.4 /100 | #128 | Exceptional 98.1% |
| Seminole | 91.5 /100 | #129 | Exceptional 98.1% |
| Immigrants | Croatia | 91.2 /100 | #130 | Exceptional 98.1% |
| Cambodians | 91.2 /100 | #131 | Exceptional 98.1% |
| Spaniards | 91.0 /100 | #132 | Exceptional 98.1% |
| Immigrants | Europe | 90.4 /100 | #133 | Exceptional 98.1% |
| Immigrants | Bulgaria | 89.4 /100 | #134 | Excellent 98.1% |
| Immigrants | Kuwait | 89.2 /100 | #135 | Excellent 98.1% |
| Immigrants | Hungary | 89.1 /100 | #136 | Excellent 98.1% |