Seminole vs Nepalese Kindergarten
COMPARE
Seminole
Nepalese
Kindergarten
Kindergarten Comparison
Seminole
Nepalese
98.1%
KINDERGARTEN
91.5/ 100
METRIC RATING
129th/ 347
METRIC RANK
96.2%
KINDERGARTEN
0.0/ 100
METRIC RATING
344th/ 347
METRIC RANK
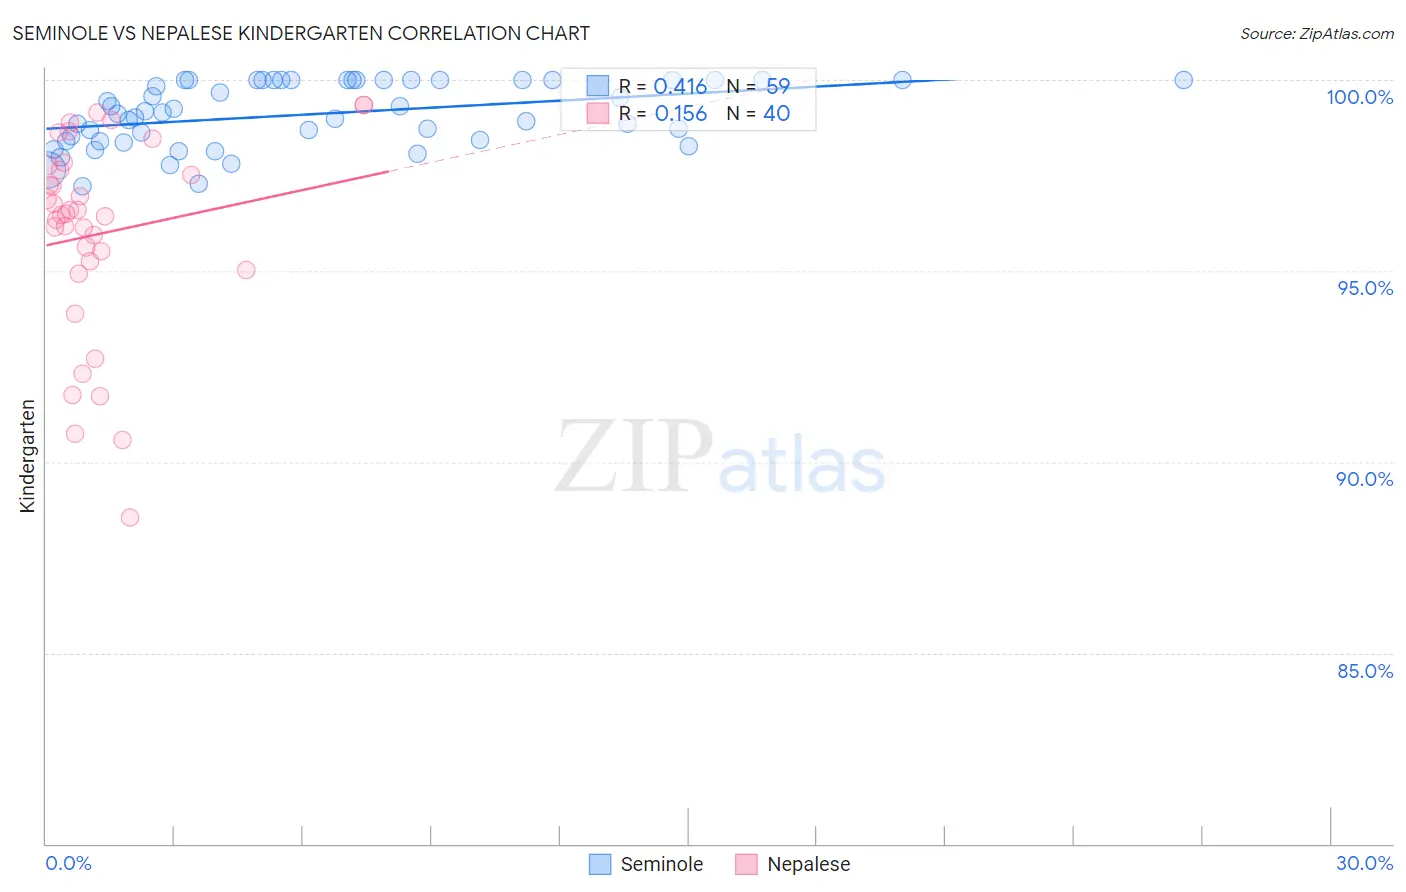
Seminole vs Nepalese Kindergarten Correlation Chart
The statistical analysis conducted on geographies consisting of 118,313,042 people shows a moderate positive correlation between the proportion of Seminole and percentage of population with at least kindergarten education in the United States with a correlation coefficient (R) of 0.416 and weighted average of 98.1%. Similarly, the statistical analysis conducted on geographies consisting of 24,521,755 people shows a poor positive correlation between the proportion of Nepalese and percentage of population with at least kindergarten education in the United States with a correlation coefficient (R) of 0.156 and weighted average of 96.2%, a difference of 2.0%.
Kindergarten Correlation Summary
| Measurement | Seminole | Nepalese |
| Minimum | 97.2% | 88.5% |
| Maximum | 100.0% | 99.3% |
| Range | 2.8% | 10.8% |
| Mean | 99.1% | 96.0% |
| Median | 99.2% | 96.5% |
| Interquartile 25% (IQ1) | 98.4% | 95.1% |
| Interquartile 75% (IQ3) | 100.0% | 97.7% |
| Interquartile Range (IQR) | 1.6% | 2.6% |
| Standard Deviation (Sample) | 0.83% | 2.6% |
| Standard Deviation (Population) | 0.83% | 2.6% |
Similar Demographics by Kindergarten
Demographics Similar to Seminole by Kindergarten
In terms of kindergarten, the demographic groups most similar to Seminole are Immigrants from Croatia (98.1%, a difference of 0.0%), Cambodian (98.1%, a difference of 0.0%), Spaniard (98.1%, a difference of 0.0%), Immigrants from Serbia (98.1%, a difference of 0.010%), and Immigrants from Europe (98.1%, a difference of 0.010%).
| Demographics | Rating | Rank | Kindergarten |
| Immigrants | Japan | 94.0 /100 | #122 | Exceptional 98.2% |
| Menominee | 93.9 /100 | #123 | Exceptional 98.2% |
| Syrians | 93.6 /100 | #124 | Exceptional 98.2% |
| Iroquois | 93.5 /100 | #125 | Exceptional 98.2% |
| Lebanese | 93.5 /100 | #126 | Exceptional 98.2% |
| Immigrants | Saudi Arabia | 93.1 /100 | #127 | Exceptional 98.1% |
| Immigrants | Serbia | 92.4 /100 | #128 | Exceptional 98.1% |
| Seminole | 91.5 /100 | #129 | Exceptional 98.1% |
| Immigrants | Croatia | 91.2 /100 | #130 | Exceptional 98.1% |
| Cambodians | 91.2 /100 | #131 | Exceptional 98.1% |
| Spaniards | 91.0 /100 | #132 | Exceptional 98.1% |
| Immigrants | Europe | 90.4 /100 | #133 | Exceptional 98.1% |
| Immigrants | Bulgaria | 89.4 /100 | #134 | Excellent 98.1% |
| Immigrants | Kuwait | 89.2 /100 | #135 | Excellent 98.1% |
| Immigrants | Hungary | 89.1 /100 | #136 | Excellent 98.1% |
Demographics Similar to Nepalese by Kindergarten
In terms of kindergarten, the demographic groups most similar to Nepalese are Immigrants from El Salvador (96.2%, a difference of 0.0%), Salvadoran (96.3%, a difference of 0.15%), Immigrants from Mexico (96.4%, a difference of 0.18%), Immigrants from Central America (96.4%, a difference of 0.21%), and Immigrants from Cabo Verde (96.4%, a difference of 0.21%).
| Demographics | Rating | Rank | Kindergarten |
| Central Americans | 0.0 /100 | #333 | Tragic 96.6% |
| Immigrants | Dominican Republic | 0.0 /100 | #334 | Tragic 96.6% |
| Bangladeshis | 0.0 /100 | #335 | Tragic 96.6% |
| Guatemalans | 0.0 /100 | #336 | Tragic 96.5% |
| Immigrants | Cambodia | 0.0 /100 | #337 | Tragic 96.5% |
| Immigrants | Fiji | 0.0 /100 | #338 | Tragic 96.5% |
| Immigrants | Guatemala | 0.0 /100 | #339 | Tragic 96.4% |
| Immigrants | Central America | 0.0 /100 | #340 | Tragic 96.4% |
| Immigrants | Cabo Verde | 0.0 /100 | #341 | Tragic 96.4% |
| Immigrants | Mexico | 0.0 /100 | #342 | Tragic 96.4% |
| Salvadorans | 0.0 /100 | #343 | Tragic 96.3% |
| Nepalese | 0.0 /100 | #344 | Tragic 96.2% |
| Immigrants | El Salvador | 0.0 /100 | #345 | Tragic 96.2% |
| Immigrants | Yemen | 0.0 /100 | #346 | Tragic 95.9% |
| Spanish American Indians | 0.0 /100 | #347 | Tragic 95.8% |