Scottish vs Immigrants from Africa 12th Grade, No Diploma
COMPARE
Scottish
Immigrants from Africa
12th Grade, No Diploma
12th Grade, No Diploma Comparison
Scottish
Immigrants from Africa
93.0%
12TH GRADE, NO DIPLOMA
99.9/ 100
METRIC RATING
36th/ 347
METRIC RANK
90.5%
12TH GRADE, NO DIPLOMA
8.5/ 100
METRIC RATING
214th/ 347
METRIC RANK
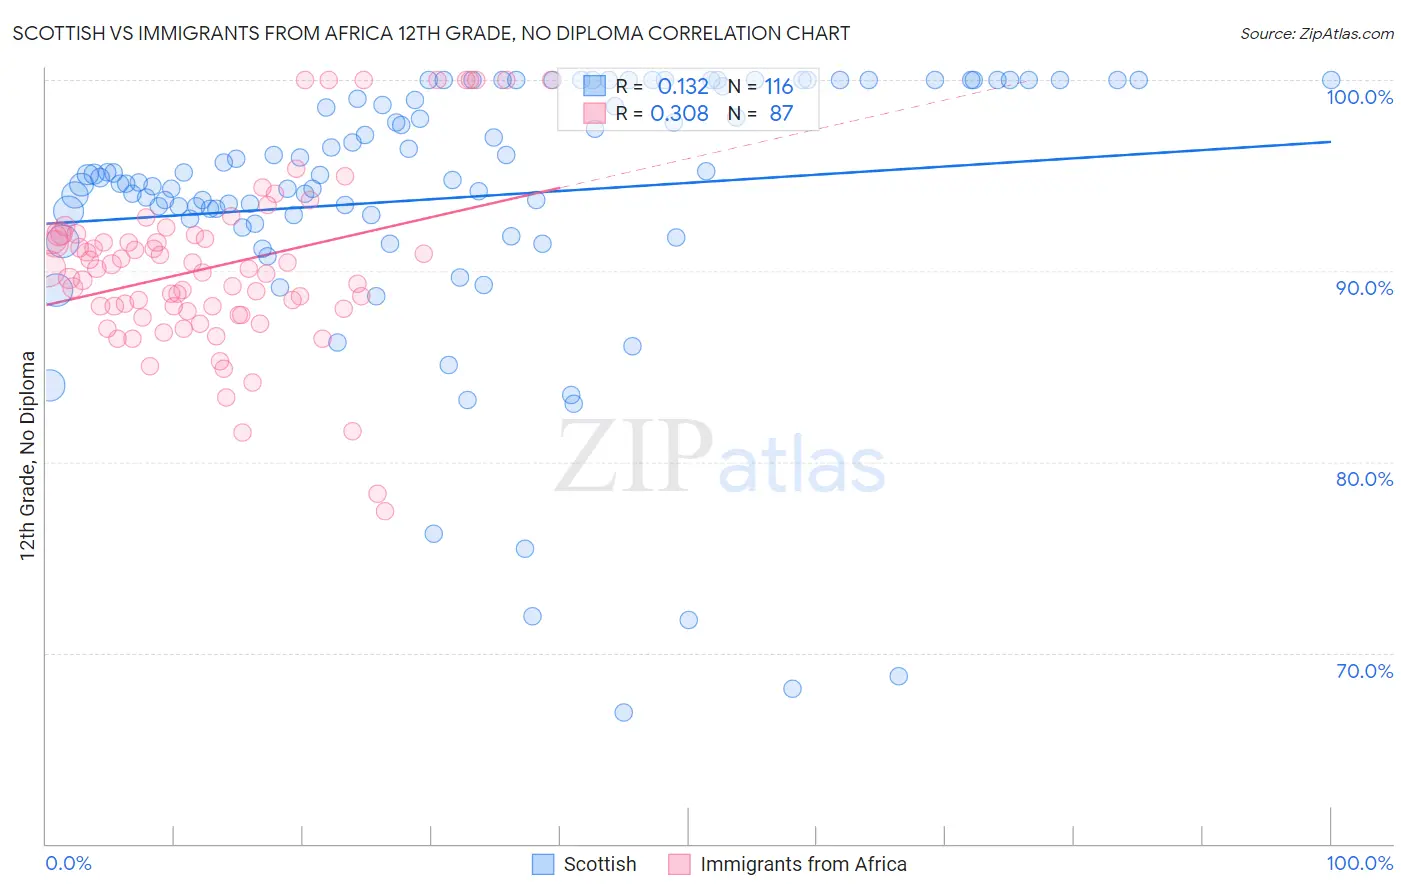
Scottish vs Immigrants from Africa 12th Grade, No Diploma Correlation Chart
The statistical analysis conducted on geographies consisting of 567,141,341 people shows a poor positive correlation between the proportion of Scottish and percentage of population with at least 12th grade (no diploma) education in the United States with a correlation coefficient (R) of 0.132 and weighted average of 93.0%. Similarly, the statistical analysis conducted on geographies consisting of 469,408,443 people shows a mild positive correlation between the proportion of Immigrants from Africa and percentage of population with at least 12th grade (no diploma) education in the United States with a correlation coefficient (R) of 0.308 and weighted average of 90.5%, a difference of 2.8%.
12th Grade, No Diploma Correlation Summary
| Measurement | Scottish | Immigrants from Africa |
| Minimum | 66.9% | 77.4% |
| Maximum | 100.0% | 100.0% |
| Range | 33.1% | 22.6% |
| Mean | 93.8% | 90.3% |
| Median | 95.0% | 90.1% |
| Interquartile 25% (IQ1) | 92.8% | 87.9% |
| Interquartile 75% (IQ3) | 99.8% | 91.9% |
| Interquartile Range (IQR) | 7.0% | 4.1% |
| Standard Deviation (Sample) | 7.1% | 4.6% |
| Standard Deviation (Population) | 7.1% | 4.6% |
Similar Demographics by 12th Grade, No Diploma
Demographics Similar to Scottish by 12th Grade, No Diploma
In terms of 12th grade, no diploma, the demographic groups most similar to Scottish are English (93.0%, a difference of 0.0%), Irish (93.0%, a difference of 0.0%), Okinawan (93.0%, a difference of 0.010%), Immigrants from Scotland (93.0%, a difference of 0.030%), and Tlingit-Haida (93.0%, a difference of 0.030%).
| Demographics | Rating | Rank | 12th Grade, No Diploma |
| Iranians | 99.9 /100 | #29 | Exceptional 93.1% |
| Immigrants | Lithuania | 99.9 /100 | #30 | Exceptional 93.1% |
| Immigrants | Ireland | 99.9 /100 | #31 | Exceptional 93.1% |
| Europeans | 99.9 /100 | #32 | Exceptional 93.1% |
| Immigrants | Scotland | 99.9 /100 | #33 | Exceptional 93.0% |
| Okinawans | 99.9 /100 | #34 | Exceptional 93.0% |
| English | 99.9 /100 | #35 | Exceptional 93.0% |
| Scottish | 99.9 /100 | #36 | Exceptional 93.0% |
| Irish | 99.9 /100 | #37 | Exceptional 93.0% |
| Tlingit-Haida | 99.8 /100 | #38 | Exceptional 93.0% |
| Immigrants | Austria | 99.8 /100 | #39 | Exceptional 93.0% |
| Turks | 99.8 /100 | #40 | Exceptional 93.0% |
| Bhutanese | 99.8 /100 | #41 | Exceptional 93.0% |
| Immigrants | Australia | 99.8 /100 | #42 | Exceptional 92.9% |
| Northern Europeans | 99.8 /100 | #43 | Exceptional 92.9% |
Demographics Similar to Immigrants from Africa by 12th Grade, No Diploma
In terms of 12th grade, no diploma, the demographic groups most similar to Immigrants from Africa are Costa Rican (90.5%, a difference of 0.030%), Arapaho (90.5%, a difference of 0.030%), Shoshone (90.5%, a difference of 0.040%), Cherokee (90.5%, a difference of 0.040%), and Immigrants from Cameroon (90.5%, a difference of 0.040%).
| Demographics | Rating | Rank | 12th Grade, No Diploma |
| Armenians | 11.6 /100 | #207 | Poor 90.6% |
| Immigrants | Micronesia | 11.0 /100 | #208 | Poor 90.6% |
| Immigrants | Afghanistan | 11.0 /100 | #209 | Poor 90.6% |
| South American Indians | 10.9 /100 | #210 | Poor 90.6% |
| Portuguese | 10.6 /100 | #211 | Poor 90.6% |
| Somalis | 10.2 /100 | #212 | Poor 90.6% |
| Costa Ricans | 9.4 /100 | #213 | Tragic 90.5% |
| Immigrants | Africa | 8.5 /100 | #214 | Tragic 90.5% |
| Arapaho | 7.7 /100 | #215 | Tragic 90.5% |
| Shoshone | 7.5 /100 | #216 | Tragic 90.5% |
| Cherokee | 7.4 /100 | #217 | Tragic 90.5% |
| Immigrants | Cameroon | 7.4 /100 | #218 | Tragic 90.5% |
| Uruguayans | 7.0 /100 | #219 | Tragic 90.4% |
| Colombians | 6.6 /100 | #220 | Tragic 90.4% |
| Immigrants | Liberia | 5.7 /100 | #221 | Tragic 90.4% |