Scottish vs Bermudan 1st Grade
COMPARE
Scottish
Bermudan
1st Grade
1st Grade Comparison
Scottish
Bermudans
98.6%
1ST GRADE
100.0/ 100
METRIC RATING
17th/ 347
METRIC RANK
97.9%
1ST GRADE
56.3/ 100
METRIC RATING
167th/ 347
METRIC RANK
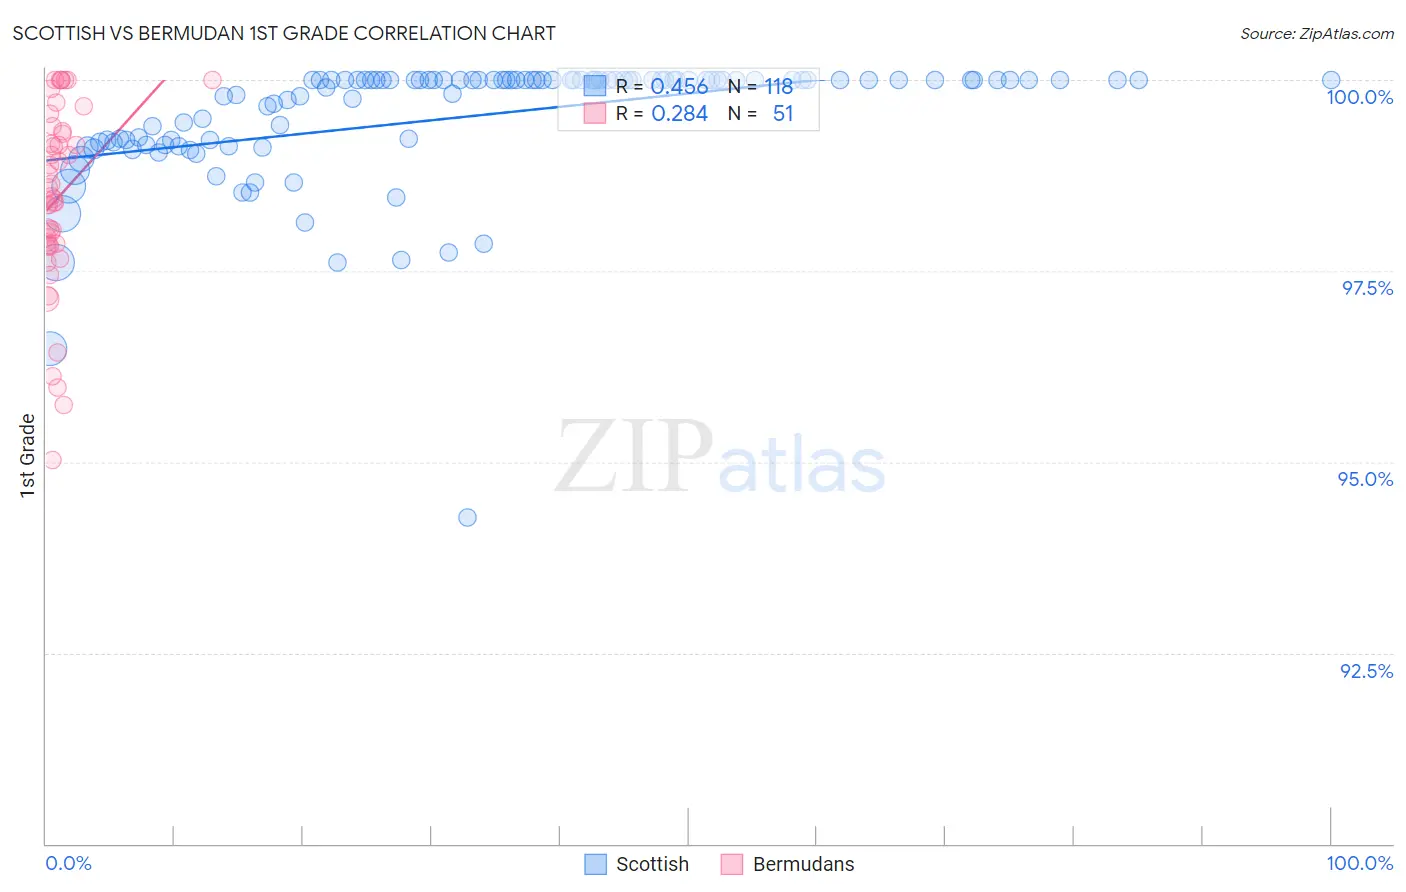
Scottish vs Bermudan 1st Grade Correlation Chart
The statistical analysis conducted on geographies consisting of 567,141,733 people shows a moderate positive correlation between the proportion of Scottish and percentage of population with at least 1st grade education in the United States with a correlation coefficient (R) of 0.456 and weighted average of 98.6%. Similarly, the statistical analysis conducted on geographies consisting of 55,721,975 people shows a weak positive correlation between the proportion of Bermudans and percentage of population with at least 1st grade education in the United States with a correlation coefficient (R) of 0.284 and weighted average of 97.9%, a difference of 0.69%.
1st Grade Correlation Summary
| Measurement | Scottish | Bermudan |
| Minimum | 94.3% | 95.0% |
| Maximum | 100.0% | 100.0% |
| Range | 5.7% | 5.0% |
| Mean | 99.5% | 98.5% |
| Median | 100.0% | 98.5% |
| Interquartile 25% (IQ1) | 99.2% | 97.8% |
| Interquartile 75% (IQ3) | 100.0% | 99.3% |
| Interquartile Range (IQR) | 0.82% | 1.5% |
| Standard Deviation (Sample) | 0.84% | 1.2% |
| Standard Deviation (Population) | 0.84% | 1.2% |
Similar Demographics by 1st Grade
Demographics Similar to Scottish by 1st Grade
In terms of 1st grade, the demographic groups most similar to Scottish are Aleut (98.6%, a difference of 0.0%), Swedish (98.6%, a difference of 0.010%), Dutch (98.6%, a difference of 0.010%), Carpatho Rusyn (98.6%, a difference of 0.030%), and English (98.6%, a difference of 0.030%).
| Demographics | Rating | Rank | 1st Grade |
| Germans | 100.0 /100 | #10 | Exceptional 98.7% |
| Tlingit-Haida | 100.0 /100 | #11 | Exceptional 98.7% |
| Slovenes | 100.0 /100 | #12 | Exceptional 98.7% |
| Carpatho Rusyns | 100.0 /100 | #13 | Exceptional 98.6% |
| English | 100.0 /100 | #14 | Exceptional 98.6% |
| Swedes | 100.0 /100 | #15 | Exceptional 98.6% |
| Aleuts | 100.0 /100 | #16 | Exceptional 98.6% |
| Scottish | 100.0 /100 | #17 | Exceptional 98.6% |
| Dutch | 100.0 /100 | #18 | Exceptional 98.6% |
| Irish | 100.0 /100 | #19 | Exceptional 98.6% |
| Sioux | 100.0 /100 | #20 | Exceptional 98.6% |
| Arapaho | 100.0 /100 | #21 | Exceptional 98.6% |
| Pennsylvania Germans | 100.0 /100 | #22 | Exceptional 98.6% |
| Finns | 100.0 /100 | #23 | Exceptional 98.6% |
| Lithuanians | 100.0 /100 | #24 | Exceptional 98.6% |
Demographics Similar to Bermudans by 1st Grade
In terms of 1st grade, the demographic groups most similar to Bermudans are Spanish American (97.9%, a difference of 0.0%), Brazilian (97.9%, a difference of 0.0%), Ugandan (97.9%, a difference of 0.0%), Navajo (97.9%, a difference of 0.0%), and Chilean (97.9%, a difference of 0.0%).
| Demographics | Rating | Rank | 1st Grade |
| Immigrants | Russia | 59.2 /100 | #160 | Average 97.9% |
| Immigrants | Italy | 59.1 /100 | #161 | Average 97.9% |
| Immigrants | Eastern Europe | 58.9 /100 | #162 | Average 97.9% |
| Spanish Americans | 57.7 /100 | #163 | Average 97.9% |
| Brazilians | 57.6 /100 | #164 | Average 97.9% |
| Ugandans | 56.9 /100 | #165 | Average 97.9% |
| Navajo | 56.6 /100 | #166 | Average 97.9% |
| Bermudans | 56.3 /100 | #167 | Average 97.9% |
| Chileans | 55.6 /100 | #168 | Average 97.9% |
| Immigrants | Micronesia | 55.3 /100 | #169 | Average 97.9% |
| Immigrants | Spain | 54.9 /100 | #170 | Average 97.9% |
| Immigrants | Jordan | 53.9 /100 | #171 | Average 97.9% |
| Immigrants | Korea | 53.0 /100 | #172 | Average 97.9% |
| Kenyans | 51.2 /100 | #173 | Average 97.9% |
| Natives/Alaskans | 50.0 /100 | #174 | Average 97.9% |