Scandinavian vs Immigrants from Belize Kindergarten
COMPARE
Scandinavian
Immigrants from Belize
Kindergarten
Kindergarten Comparison
Scandinavians
Immigrants from Belize
98.6%
KINDERGARTEN
100.0/ 100
METRIC RATING
33rd/ 347
METRIC RANK
96.9%
KINDERGARTEN
0.0/ 100
METRIC RATING
315th/ 347
METRIC RANK
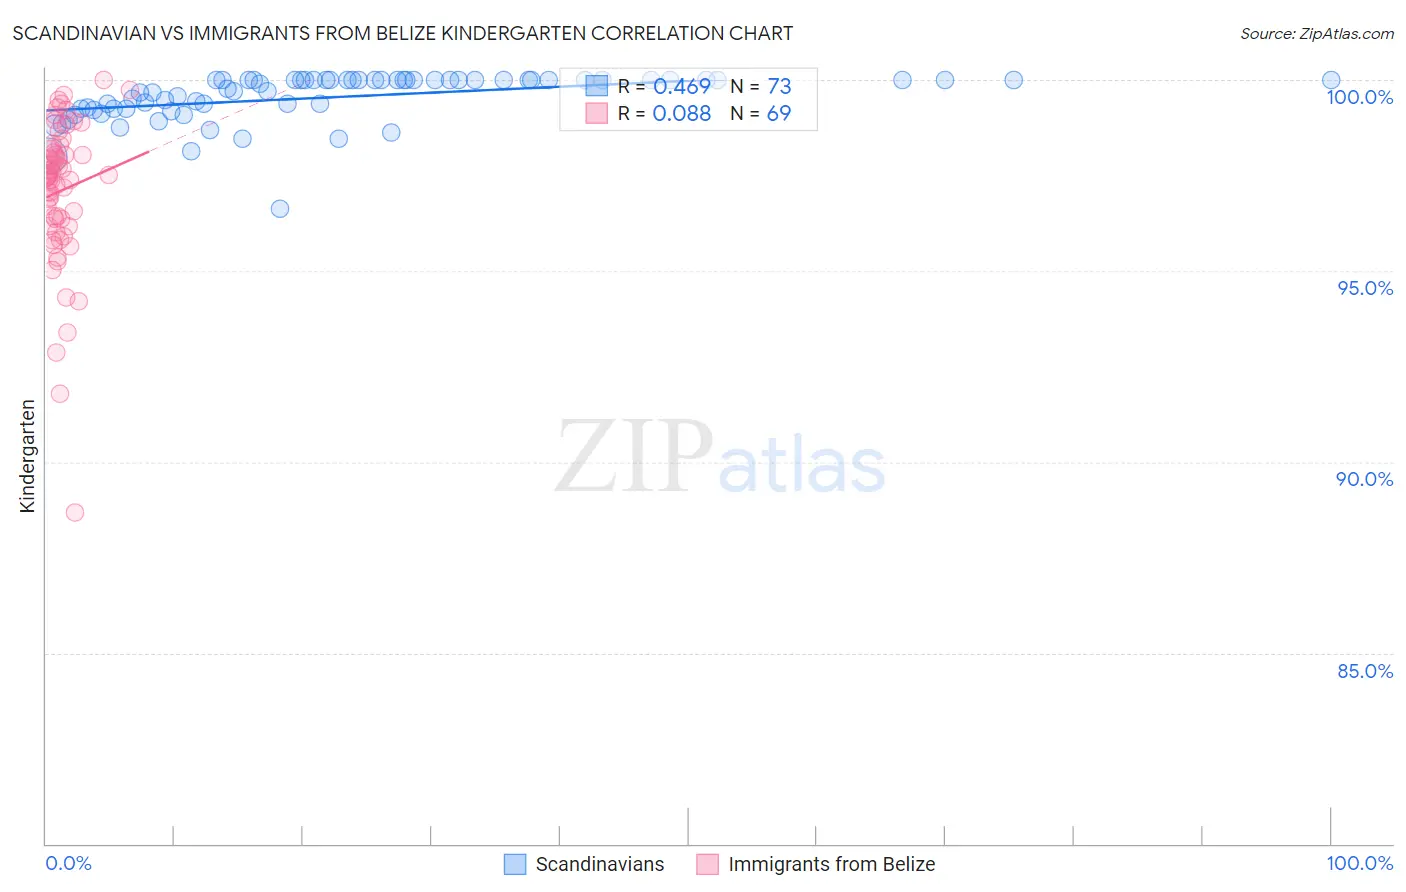
Scandinavian vs Immigrants from Belize Kindergarten Correlation Chart
The statistical analysis conducted on geographies consisting of 472,660,430 people shows a moderate positive correlation between the proportion of Scandinavians and percentage of population with at least kindergarten education in the United States with a correlation coefficient (R) of 0.469 and weighted average of 98.6%. Similarly, the statistical analysis conducted on geographies consisting of 130,328,311 people shows a slight positive correlation between the proportion of Immigrants from Belize and percentage of population with at least kindergarten education in the United States with a correlation coefficient (R) of 0.088 and weighted average of 96.9%, a difference of 1.7%.
Kindergarten Correlation Summary
| Measurement | Scandinavian | Immigrants from Belize |
| Minimum | 96.6% | 88.7% |
| Maximum | 100.0% | 100.0% |
| Range | 3.4% | 11.3% |
| Mean | 99.6% | 97.1% |
| Median | 100.0% | 97.5% |
| Interquartile 25% (IQ1) | 99.2% | 96.3% |
| Interquartile 75% (IQ3) | 100.0% | 98.1% |
| Interquartile Range (IQR) | 0.75% | 1.9% |
| Standard Deviation (Sample) | 0.63% | 1.9% |
| Standard Deviation (Population) | 0.62% | 1.9% |
Similar Demographics by Kindergarten
Demographics Similar to Scandinavians by Kindergarten
In terms of kindergarten, the demographic groups most similar to Scandinavians are French Canadian (98.6%, a difference of 0.0%), French (98.6%, a difference of 0.010%), European (98.6%, a difference of 0.010%), Czech (98.6%, a difference of 0.010%), and Croatian (98.6%, a difference of 0.020%).
| Demographics | Rating | Rank | Kindergarten |
| Poles | 100.0 /100 | #26 | Exceptional 98.6% |
| Scotch-Irish | 100.0 /100 | #27 | Exceptional 98.6% |
| Croatians | 100.0 /100 | #28 | Exceptional 98.6% |
| French | 100.0 /100 | #29 | Exceptional 98.6% |
| Europeans | 100.0 /100 | #30 | Exceptional 98.6% |
| Czechs | 100.0 /100 | #31 | Exceptional 98.6% |
| French Canadians | 100.0 /100 | #32 | Exceptional 98.6% |
| Scandinavians | 100.0 /100 | #33 | Exceptional 98.6% |
| Chinese | 100.0 /100 | #34 | Exceptional 98.5% |
| Swiss | 100.0 /100 | #35 | Exceptional 98.5% |
| British | 99.9 /100 | #36 | Exceptional 98.5% |
| Italians | 99.9 /100 | #37 | Exceptional 98.5% |
| Latvians | 99.9 /100 | #38 | Exceptional 98.5% |
| Chippewa | 99.9 /100 | #39 | Exceptional 98.5% |
| Luxembourgers | 99.9 /100 | #40 | Exceptional 98.5% |
Demographics Similar to Immigrants from Belize by Kindergarten
In terms of kindergarten, the demographic groups most similar to Immigrants from Belize are Honduran (96.9%, a difference of 0.010%), Immigrants from Nicaragua (96.9%, a difference of 0.010%), Immigrants from Ecuador (96.9%, a difference of 0.010%), Cape Verdean (96.9%, a difference of 0.020%), and Guyanese (96.9%, a difference of 0.030%).
| Demographics | Rating | Rank | Kindergarten |
| Immigrants | Somalia | 0.0 /100 | #308 | Tragic 97.0% |
| Immigrants | Haiti | 0.0 /100 | #309 | Tragic 97.0% |
| Immigrants | Azores | 0.0 /100 | #310 | Tragic 97.0% |
| Sri Lankans | 0.0 /100 | #311 | Tragic 97.0% |
| Guyanese | 0.0 /100 | #312 | Tragic 96.9% |
| Cape Verdeans | 0.0 /100 | #313 | Tragic 96.9% |
| Hondurans | 0.0 /100 | #314 | Tragic 96.9% |
| Immigrants | Belize | 0.0 /100 | #315 | Tragic 96.9% |
| Immigrants | Nicaragua | 0.0 /100 | #316 | Tragic 96.9% |
| Immigrants | Ecuador | 0.0 /100 | #317 | Tragic 96.9% |
| Immigrants | Laos | 0.0 /100 | #318 | Tragic 96.9% |
| Immigrants | Guyana | 0.0 /100 | #319 | Tragic 96.8% |
| Immigrants | Burma/Myanmar | 0.0 /100 | #320 | Tragic 96.8% |
| Immigrants | Bangladesh | 0.0 /100 | #321 | Tragic 96.8% |
| Mexican American Indians | 0.0 /100 | #322 | Tragic 96.8% |