Scandinavian vs Immigrants from Belgium 5th Grade
COMPARE
Scandinavian
Immigrants from Belgium
5th Grade
5th Grade Comparison
Scandinavians
Immigrants from Belgium
98.2%
5TH GRADE
100.0/ 100
METRIC RATING
29th/ 347
METRIC RANK
97.8%
5TH GRADE
99.0/ 100
METRIC RATING
85th/ 347
METRIC RANK
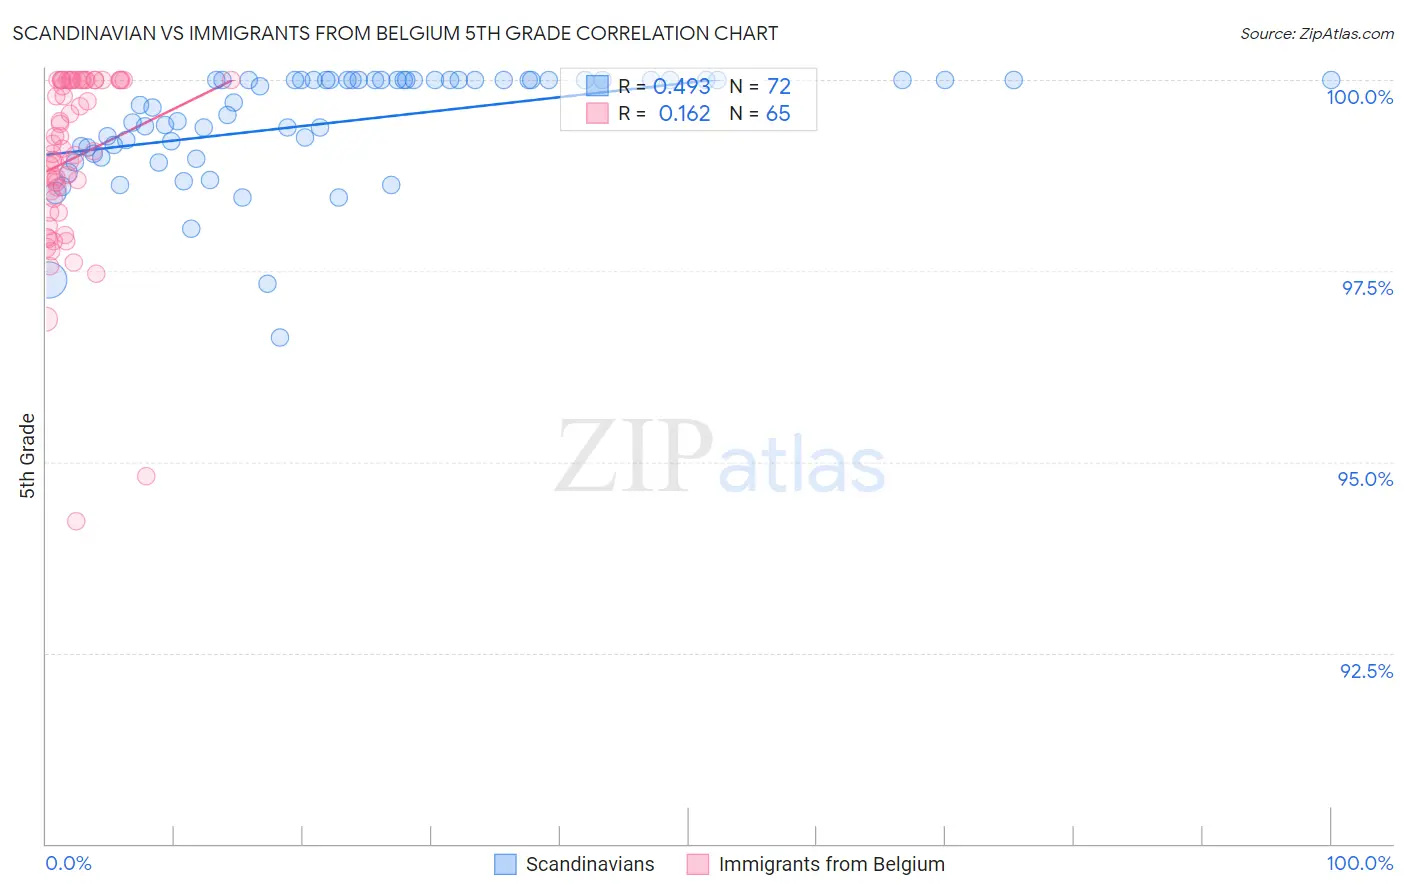
Scandinavian vs Immigrants from Belgium 5th Grade Correlation Chart
The statistical analysis conducted on geographies consisting of 472,660,325 people shows a moderate positive correlation between the proportion of Scandinavians and percentage of population with at least 5th grade education in the United States with a correlation coefficient (R) of 0.493 and weighted average of 98.2%. Similarly, the statistical analysis conducted on geographies consisting of 146,727,969 people shows a poor positive correlation between the proportion of Immigrants from Belgium and percentage of population with at least 5th grade education in the United States with a correlation coefficient (R) of 0.162 and weighted average of 97.8%, a difference of 0.39%.
5th Grade Correlation Summary
| Measurement | Scandinavian | Immigrants from Belgium |
| Minimum | 96.6% | 94.2% |
| Maximum | 100.0% | 100.0% |
| Range | 3.4% | 5.8% |
| Mean | 99.4% | 99.0% |
| Median | 99.8% | 99.1% |
| Interquartile 25% (IQ1) | 99.1% | 98.4% |
| Interquartile 75% (IQ3) | 100.0% | 100.0% |
| Interquartile Range (IQR) | 0.93% | 1.6% |
| Standard Deviation (Sample) | 0.73% | 1.2% |
| Standard Deviation (Population) | 0.73% | 1.2% |
Similar Demographics by 5th Grade
Demographics Similar to Scandinavians by 5th Grade
In terms of 5th grade, the demographic groups most similar to Scandinavians are French Canadian (98.2%, a difference of 0.0%), French (98.2%, a difference of 0.010%), Czech (98.2%, a difference of 0.010%), European (98.2%, a difference of 0.010%), and Yup'ik (98.2%, a difference of 0.020%).
| Demographics | Rating | Rank | 5th Grade |
| Croatians | 100.0 /100 | #22 | Exceptional 98.2% |
| Sioux | 100.0 /100 | #23 | Exceptional 98.2% |
| Scotch-Irish | 100.0 /100 | #24 | Exceptional 98.2% |
| Yup'ik | 100.0 /100 | #25 | Exceptional 98.2% |
| Alaska Natives | 100.0 /100 | #26 | Exceptional 98.2% |
| French | 100.0 /100 | #27 | Exceptional 98.2% |
| Czechs | 100.0 /100 | #28 | Exceptional 98.2% |
| Scandinavians | 100.0 /100 | #29 | Exceptional 98.2% |
| French Canadians | 100.0 /100 | #30 | Exceptional 98.2% |
| Europeans | 100.0 /100 | #31 | Exceptional 98.2% |
| Chippewa | 100.0 /100 | #32 | Exceptional 98.1% |
| Swiss | 100.0 /100 | #33 | Exceptional 98.1% |
| Chinese | 100.0 /100 | #34 | Exceptional 98.1% |
| Italians | 100.0 /100 | #35 | Exceptional 98.1% |
| British | 100.0 /100 | #36 | Exceptional 98.1% |
Demographics Similar to Immigrants from Belgium by 5th Grade
In terms of 5th grade, the demographic groups most similar to Immigrants from Belgium are Zimbabwean (97.8%, a difference of 0.0%), Potawatomi (97.8%, a difference of 0.0%), Cypriot (97.8%, a difference of 0.010%), Immigrants from India (97.8%, a difference of 0.020%), and Icelander (97.8%, a difference of 0.020%).
| Demographics | Rating | Rank | 5th Grade |
| Osage | 99.3 /100 | #78 | Exceptional 97.8% |
| Immigrants | Lithuania | 99.2 /100 | #79 | Exceptional 97.8% |
| Immigrants | India | 99.2 /100 | #80 | Exceptional 97.8% |
| Icelanders | 99.2 /100 | #81 | Exceptional 97.8% |
| Pueblo | 99.2 /100 | #82 | Exceptional 97.8% |
| Zimbabweans | 99.0 /100 | #83 | Exceptional 97.8% |
| Potawatomi | 99.0 /100 | #84 | Exceptional 97.8% |
| Immigrants | Belgium | 99.0 /100 | #85 | Exceptional 97.8% |
| Cypriots | 98.9 /100 | #86 | Exceptional 97.8% |
| Immigrants | Australia | 98.8 /100 | #87 | Exceptional 97.8% |
| Shoshone | 98.8 /100 | #88 | Exceptional 97.8% |
| Immigrants | South Africa | 98.8 /100 | #89 | Exceptional 97.8% |
| Immigrants | Ireland | 98.8 /100 | #90 | Exceptional 97.8% |
| Immigrants | Western Europe | 98.8 /100 | #91 | Exceptional 97.8% |
| Immigrants | Sweden | 98.7 /100 | #92 | Exceptional 97.8% |