Samoan vs Peruvian 2nd Grade
COMPARE
Samoan
Peruvian
2nd Grade
2nd Grade Comparison
Samoans
Peruvians
97.7%
2ND GRADE
7.1/ 100
METRIC RATING
214th/ 347
METRIC RANK
97.5%
2ND GRADE
0.9/ 100
METRIC RATING
250th/ 347
METRIC RANK
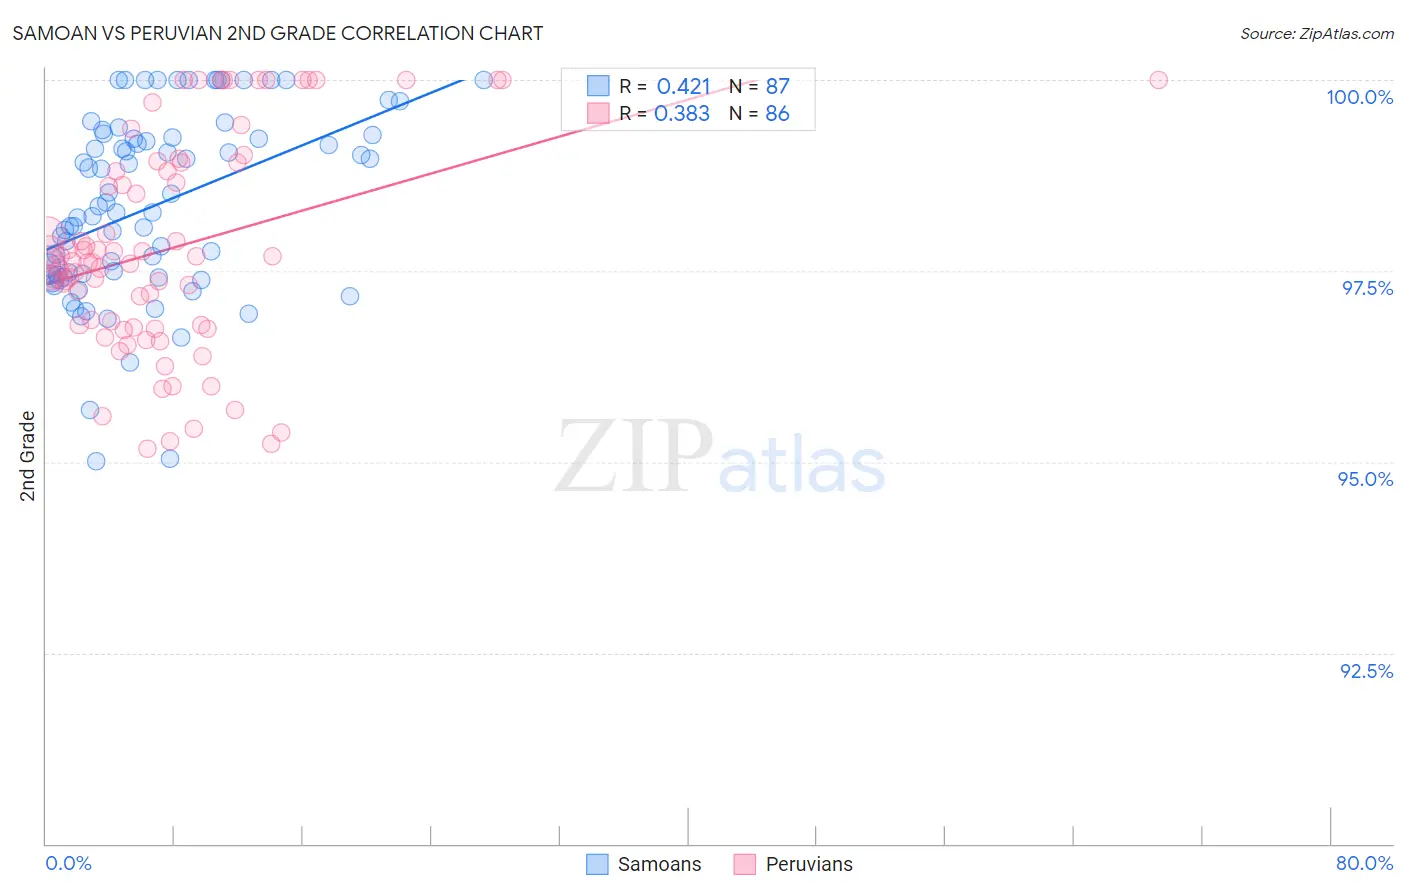
Samoan vs Peruvian 2nd Grade Correlation Chart
The statistical analysis conducted on geographies consisting of 225,201,431 people shows a moderate positive correlation between the proportion of Samoans and percentage of population with at least 2nd grade education in the United States with a correlation coefficient (R) of 0.421 and weighted average of 97.7%. Similarly, the statistical analysis conducted on geographies consisting of 363,068,462 people shows a mild positive correlation between the proportion of Peruvians and percentage of population with at least 2nd grade education in the United States with a correlation coefficient (R) of 0.383 and weighted average of 97.5%, a difference of 0.17%.
2nd Grade Correlation Summary
| Measurement | Samoan | Peruvian |
| Minimum | 95.0% | 95.2% |
| Maximum | 100.0% | 100.0% |
| Range | 5.0% | 4.8% |
| Mean | 98.3% | 97.8% |
| Median | 98.3% | 97.6% |
| Interquartile 25% (IQ1) | 97.4% | 96.8% |
| Interquartile 75% (IQ3) | 99.2% | 98.9% |
| Interquartile Range (IQR) | 1.8% | 2.1% |
| Standard Deviation (Sample) | 1.2% | 1.4% |
| Standard Deviation (Population) | 1.2% | 1.4% |
Similar Demographics by 2nd Grade
Demographics Similar to Samoans by 2nd Grade
In terms of 2nd grade, the demographic groups most similar to Samoans are Bahamian (97.7%, a difference of 0.0%), Immigrants from Bahamas (97.7%, a difference of 0.010%), Moroccan (97.7%, a difference of 0.010%), South American Indian (97.7%, a difference of 0.010%), and Uruguayan (97.7%, a difference of 0.010%).
| Demographics | Rating | Rank | 2nd Grade |
| Africans | 15.6 /100 | #207 | Poor 97.7% |
| Immigrants | Northern Africa | 12.3 /100 | #208 | Poor 97.7% |
| Immigrants | Oceania | 10.9 /100 | #209 | Poor 97.7% |
| Costa Ricans | 10.5 /100 | #210 | Poor 97.7% |
| Laotians | 9.9 /100 | #211 | Tragic 97.7% |
| Immigrants | Bahamas | 8.4 /100 | #212 | Tragic 97.7% |
| Moroccans | 8.2 /100 | #213 | Tragic 97.7% |
| Samoans | 7.1 /100 | #214 | Tragic 97.7% |
| Bahamians | 6.8 /100 | #215 | Tragic 97.7% |
| South American Indians | 6.7 /100 | #216 | Tragic 97.7% |
| Uruguayans | 6.2 /100 | #217 | Tragic 97.7% |
| Sudanese | 5.7 /100 | #218 | Tragic 97.7% |
| Immigrants | Panama | 5.1 /100 | #219 | Tragic 97.6% |
| Immigrants | Morocco | 5.0 /100 | #220 | Tragic 97.6% |
| Iraqis | 4.6 /100 | #221 | Tragic 97.6% |
Demographics Similar to Peruvians by 2nd Grade
In terms of 2nd grade, the demographic groups most similar to Peruvians are Bolivian (97.5%, a difference of 0.0%), Immigrants from Iraq (97.5%, a difference of 0.010%), Immigrants from Eastern Africa (97.5%, a difference of 0.010%), South American (97.5%, a difference of 0.010%), and Immigrants from Senegal (97.5%, a difference of 0.010%).
| Demographics | Rating | Rank | 2nd Grade |
| Asians | 1.1 /100 | #243 | Tragic 97.5% |
| Immigrants | Iraq | 1.0 /100 | #244 | Tragic 97.5% |
| Immigrants | Eastern Africa | 0.9 /100 | #245 | Tragic 97.5% |
| South Americans | 0.9 /100 | #246 | Tragic 97.5% |
| Immigrants | Senegal | 0.9 /100 | #247 | Tragic 97.5% |
| Immigrants | Middle Africa | 0.9 /100 | #248 | Tragic 97.5% |
| Bolivians | 0.9 /100 | #249 | Tragic 97.5% |
| Peruvians | 0.9 /100 | #250 | Tragic 97.5% |
| Immigrants | Africa | 0.8 /100 | #251 | Tragic 97.5% |
| Immigrants | Asia | 0.7 /100 | #252 | Tragic 97.5% |
| Puerto Ricans | 0.7 /100 | #253 | Tragic 97.5% |
| Indians (Asian) | 0.6 /100 | #254 | Tragic 97.5% |
| Immigrants | Congo | 0.6 /100 | #255 | Tragic 97.5% |
| Jamaicans | 0.6 /100 | #256 | Tragic 97.5% |
| Immigrants | Colombia | 0.5 /100 | #257 | Tragic 97.5% |