Puerto Rican vs Immigrants from Morocco 9th Grade
COMPARE
Puerto Rican
Immigrants from Morocco
9th Grade
9th Grade Comparison
Puerto Ricans
Immigrants from Morocco
91.8%
9TH GRADE
0.0/ 100
METRIC RATING
323rd/ 347
METRIC RANK
94.6%
9TH GRADE
16.3/ 100
METRIC RATING
207th/ 347
METRIC RANK
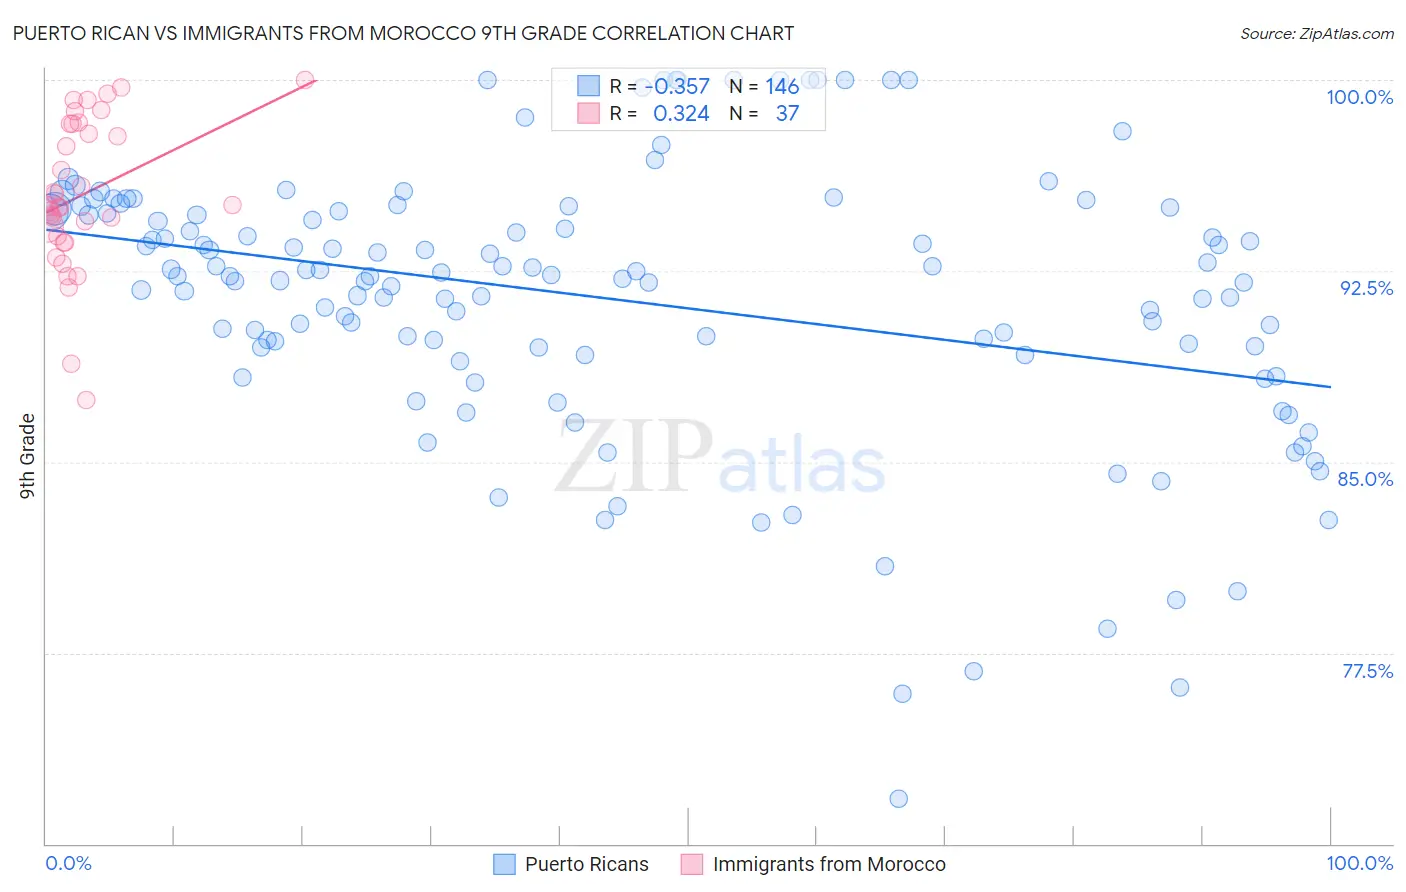
Puerto Rican vs Immigrants from Morocco 9th Grade Correlation Chart
The statistical analysis conducted on geographies consisting of 528,320,060 people shows a mild negative correlation between the proportion of Puerto Ricans and percentage of population with at least 9th grade education in the United States with a correlation coefficient (R) of -0.357 and weighted average of 91.8%. Similarly, the statistical analysis conducted on geographies consisting of 178,912,438 people shows a mild positive correlation between the proportion of Immigrants from Morocco and percentage of population with at least 9th grade education in the United States with a correlation coefficient (R) of 0.324 and weighted average of 94.6%, a difference of 3.0%.
9th Grade Correlation Summary
| Measurement | Puerto Rican | Immigrants from Morocco |
| Minimum | 71.8% | 87.4% |
| Maximum | 100.0% | 100.0% |
| Range | 28.2% | 12.6% |
| Mean | 91.4% | 95.5% |
| Median | 92.3% | 95.1% |
| Interquartile 25% (IQ1) | 89.5% | 93.8% |
| Interquartile 75% (IQ3) | 94.8% | 98.3% |
| Interquartile Range (IQR) | 5.3% | 4.5% |
| Standard Deviation (Sample) | 5.3% | 3.0% |
| Standard Deviation (Population) | 5.3% | 2.9% |
Similar Demographics by 9th Grade
Demographics Similar to Puerto Ricans by 9th Grade
In terms of 9th grade, the demographic groups most similar to Puerto Ricans are Belizean (91.8%, a difference of 0.0%), Immigrants from Ecuador (91.8%, a difference of 0.030%), Immigrants from Belize (91.8%, a difference of 0.060%), Nicaraguan (91.9%, a difference of 0.090%), and Ecuadorian (91.9%, a difference of 0.14%).
| Demographics | Rating | Rank | 9th Grade |
| Cape Verdeans | 0.0 /100 | #316 | Tragic 92.2% |
| Immigrants | Cuba | 0.0 /100 | #317 | Tragic 92.2% |
| Nepalese | 0.0 /100 | #318 | Tragic 92.0% |
| Ecuadorians | 0.0 /100 | #319 | Tragic 91.9% |
| Nicaraguans | 0.0 /100 | #320 | Tragic 91.9% |
| Immigrants | Ecuador | 0.0 /100 | #321 | Tragic 91.8% |
| Belizeans | 0.0 /100 | #322 | Tragic 91.8% |
| Puerto Ricans | 0.0 /100 | #323 | Tragic 91.8% |
| Immigrants | Belize | 0.0 /100 | #324 | Tragic 91.8% |
| Central American Indians | 0.0 /100 | #325 | Tragic 91.5% |
| Immigrants | Armenia | 0.0 /100 | #326 | Tragic 91.4% |
| Immigrants | Nicaragua | 0.0 /100 | #327 | Tragic 91.3% |
| Dominicans | 0.0 /100 | #328 | Tragic 91.1% |
| Hondurans | 0.0 /100 | #329 | Tragic 91.0% |
| Immigrants | Cabo Verde | 0.0 /100 | #330 | Tragic 90.9% |
Demographics Similar to Immigrants from Morocco by 9th Grade
In terms of 9th grade, the demographic groups most similar to Immigrants from Morocco are Samoan (94.6%, a difference of 0.010%), Immigrants from Pakistan (94.6%, a difference of 0.010%), Immigrants from Sudan (94.6%, a difference of 0.020%), Comanche (94.6%, a difference of 0.020%), and Immigrants from Eastern Asia (94.6%, a difference of 0.040%).
| Demographics | Rating | Rank | 9th Grade |
| Immigrants | Zaire | 20.6 /100 | #200 | Fair 94.6% |
| Blacks/African Americans | 20.5 /100 | #201 | Fair 94.6% |
| Immigrants | Eastern Asia | 19.8 /100 | #202 | Poor 94.6% |
| Immigrants | Bahamas | 19.8 /100 | #203 | Poor 94.6% |
| Moroccans | 19.6 /100 | #204 | Poor 94.6% |
| Immigrants | Sudan | 17.6 /100 | #205 | Poor 94.6% |
| Samoans | 17.3 /100 | #206 | Poor 94.6% |
| Immigrants | Morocco | 16.3 /100 | #207 | Poor 94.6% |
| Immigrants | Pakistan | 15.5 /100 | #208 | Poor 94.6% |
| Comanche | 14.9 /100 | #209 | Poor 94.6% |
| Immigrants | Chile | 13.4 /100 | #210 | Poor 94.5% |
| Immigrants | Indonesia | 12.3 /100 | #211 | Poor 94.5% |
| Immigrants | Malaysia | 12.2 /100 | #212 | Poor 94.5% |
| Immigrants | Oceania | 12.1 /100 | #213 | Poor 94.5% |
| Immigrants | Liberia | 11.8 /100 | #214 | Poor 94.5% |