Puerto Rican vs Immigrants from Mexico 1st Grade
COMPARE
Puerto Rican
Immigrants from Mexico
1st Grade
1st Grade Comparison
Puerto Ricans
Immigrants from Mexico
97.7%
1ST GRADE
3.0/ 100
METRIC RATING
231st/ 347
METRIC RANK
96.3%
1ST GRADE
0.0/ 100
METRIC RATING
342nd/ 347
METRIC RANK
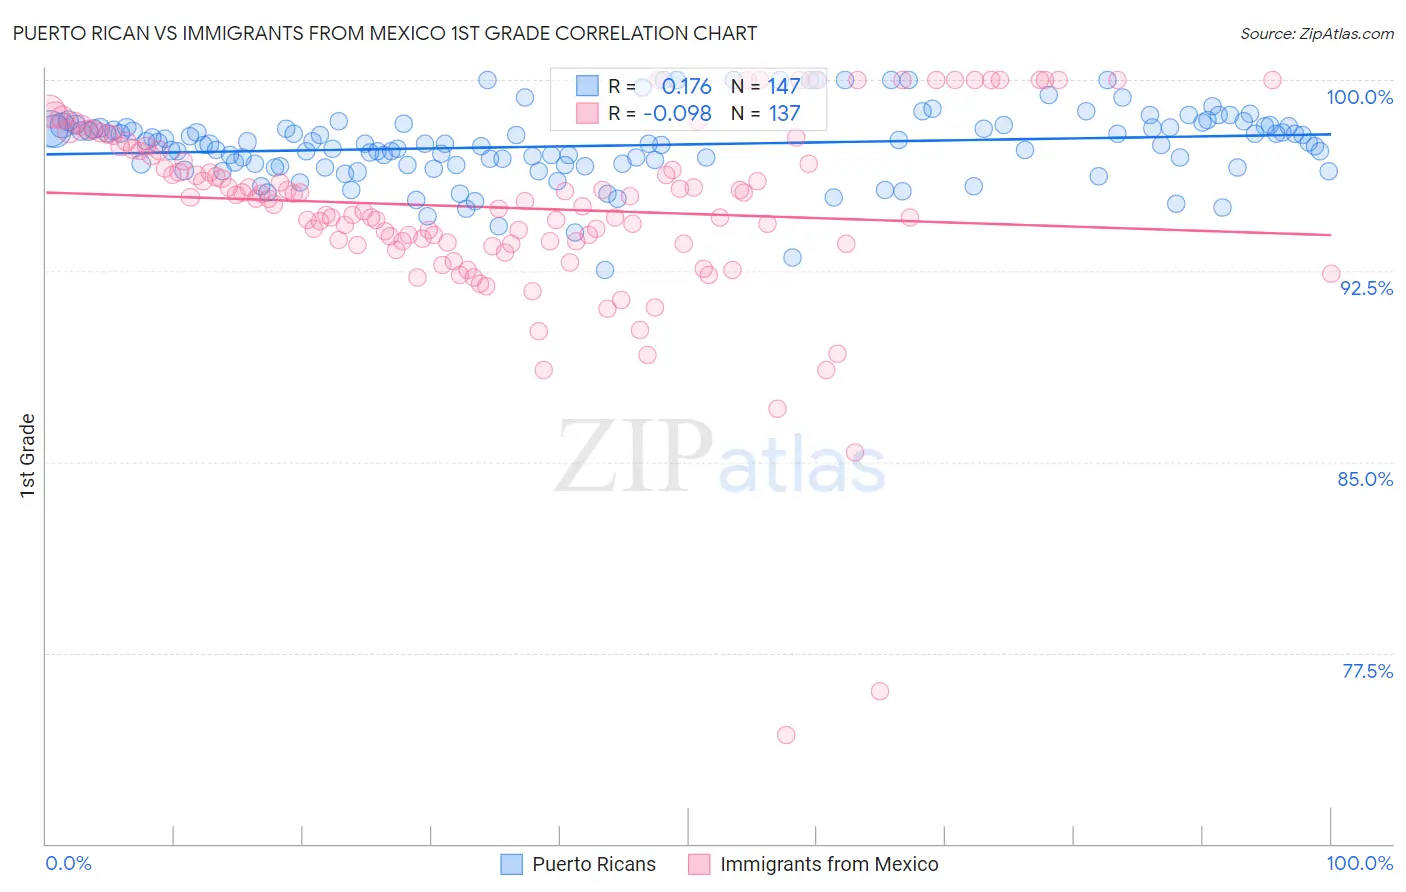
Puerto Rican vs Immigrants from Mexico 1st Grade Correlation Chart
The statistical analysis conducted on geographies consisting of 528,320,522 people shows a poor positive correlation between the proportion of Puerto Ricans and percentage of population with at least 1st grade education in the United States with a correlation coefficient (R) of 0.176 and weighted average of 97.7%. Similarly, the statistical analysis conducted on geographies consisting of 513,767,418 people shows a slight negative correlation between the proportion of Immigrants from Mexico and percentage of population with at least 1st grade education in the United States with a correlation coefficient (R) of -0.098 and weighted average of 96.3%, a difference of 1.4%.
1st Grade Correlation Summary
| Measurement | Puerto Rican | Immigrants from Mexico |
| Minimum | 92.6% | 74.3% |
| Maximum | 100.0% | 100.0% |
| Range | 7.4% | 25.7% |
| Mean | 97.4% | 95.0% |
| Median | 97.5% | 95.3% |
| Interquartile 25% (IQ1) | 96.7% | 93.6% |
| Interquartile 75% (IQ3) | 98.2% | 97.3% |
| Interquartile Range (IQR) | 1.5% | 3.7% |
| Standard Deviation (Sample) | 1.4% | 3.8% |
| Standard Deviation (Population) | 1.4% | 3.8% |
Similar Demographics by 1st Grade
Demographics Similar to Puerto Ricans by 1st Grade
In terms of 1st grade, the demographic groups most similar to Puerto Ricans are Immigrants from Costa Rica (97.7%, a difference of 0.010%), Senegalese (97.7%, a difference of 0.010%), Immigrants from Uruguay (97.6%, a difference of 0.010%), Iraqi (97.7%, a difference of 0.020%), and Immigrants from Nepal (97.7%, a difference of 0.020%).
| Demographics | Rating | Rank | 1st Grade |
| Iraqis | 4.0 /100 | #224 | Tragic 97.7% |
| Immigrants | Nepal | 4.0 /100 | #225 | Tragic 97.7% |
| Sudanese | 3.7 /100 | #226 | Tragic 97.7% |
| Sierra Leoneans | 3.6 /100 | #227 | Tragic 97.7% |
| Sub-Saharan Africans | 3.6 /100 | #228 | Tragic 97.7% |
| Immigrants | Costa Rica | 3.5 /100 | #229 | Tragic 97.7% |
| Senegalese | 3.5 /100 | #230 | Tragic 97.7% |
| Puerto Ricans | 3.0 /100 | #231 | Tragic 97.7% |
| Immigrants | Uruguay | 2.5 /100 | #232 | Tragic 97.6% |
| Immigrants | Pakistan | 2.2 /100 | #233 | Tragic 97.6% |
| Colombians | 2.2 /100 | #234 | Tragic 97.6% |
| Immigrants | Malaysia | 2.1 /100 | #235 | Tragic 97.6% |
| Immigrants | Western Asia | 2.1 /100 | #236 | Tragic 97.6% |
| U.S. Virgin Islanders | 1.9 /100 | #237 | Tragic 97.6% |
| Nigerians | 1.8 /100 | #238 | Tragic 97.6% |
Demographics Similar to Immigrants from Mexico by 1st Grade
In terms of 1st grade, the demographic groups most similar to Immigrants from Mexico are Immigrants from Central America (96.3%, a difference of 0.030%), Salvadoran (96.3%, a difference of 0.030%), Immigrants from Cabo Verde (96.3%, a difference of 0.050%), Immigrants from Guatemala (96.4%, a difference of 0.070%), and Immigrants from Fiji (96.4%, a difference of 0.14%).
| Demographics | Rating | Rank | 1st Grade |
| Immigrants | Dominican Republic | 0.0 /100 | #333 | Tragic 96.5% |
| Bangladeshis | 0.0 /100 | #334 | Tragic 96.5% |
| Yakama | 0.0 /100 | #335 | Tragic 96.5% |
| Guatemalans | 0.0 /100 | #336 | Tragic 96.5% |
| Immigrants | Cambodia | 0.0 /100 | #337 | Tragic 96.5% |
| Immigrants | Fiji | 0.0 /100 | #338 | Tragic 96.4% |
| Immigrants | Guatemala | 0.0 /100 | #339 | Tragic 96.4% |
| Immigrants | Cabo Verde | 0.0 /100 | #340 | Tragic 96.3% |
| Immigrants | Central America | 0.0 /100 | #341 | Tragic 96.3% |
| Immigrants | Mexico | 0.0 /100 | #342 | Tragic 96.3% |
| Salvadorans | 0.0 /100 | #343 | Tragic 96.3% |
| Nepalese | 0.0 /100 | #344 | Tragic 96.1% |
| Immigrants | El Salvador | 0.0 /100 | #345 | Tragic 96.1% |
| Immigrants | Yemen | 0.0 /100 | #346 | Tragic 95.8% |
| Spanish American Indians | 0.0 /100 | #347 | Tragic 95.7% |