Puerto Rican vs Immigrants from Afghanistan Nursery School
COMPARE
Puerto Rican
Immigrants from Afghanistan
Nursery School
Nursery School Comparison
Puerto Ricans
Immigrants from Afghanistan
97.7%
NURSERY SCHOOL
2.6/ 100
METRIC RATING
231st/ 347
METRIC RANK
97.3%
NURSERY SCHOOL
0.0/ 100
METRIC RATING
290th/ 347
METRIC RANK
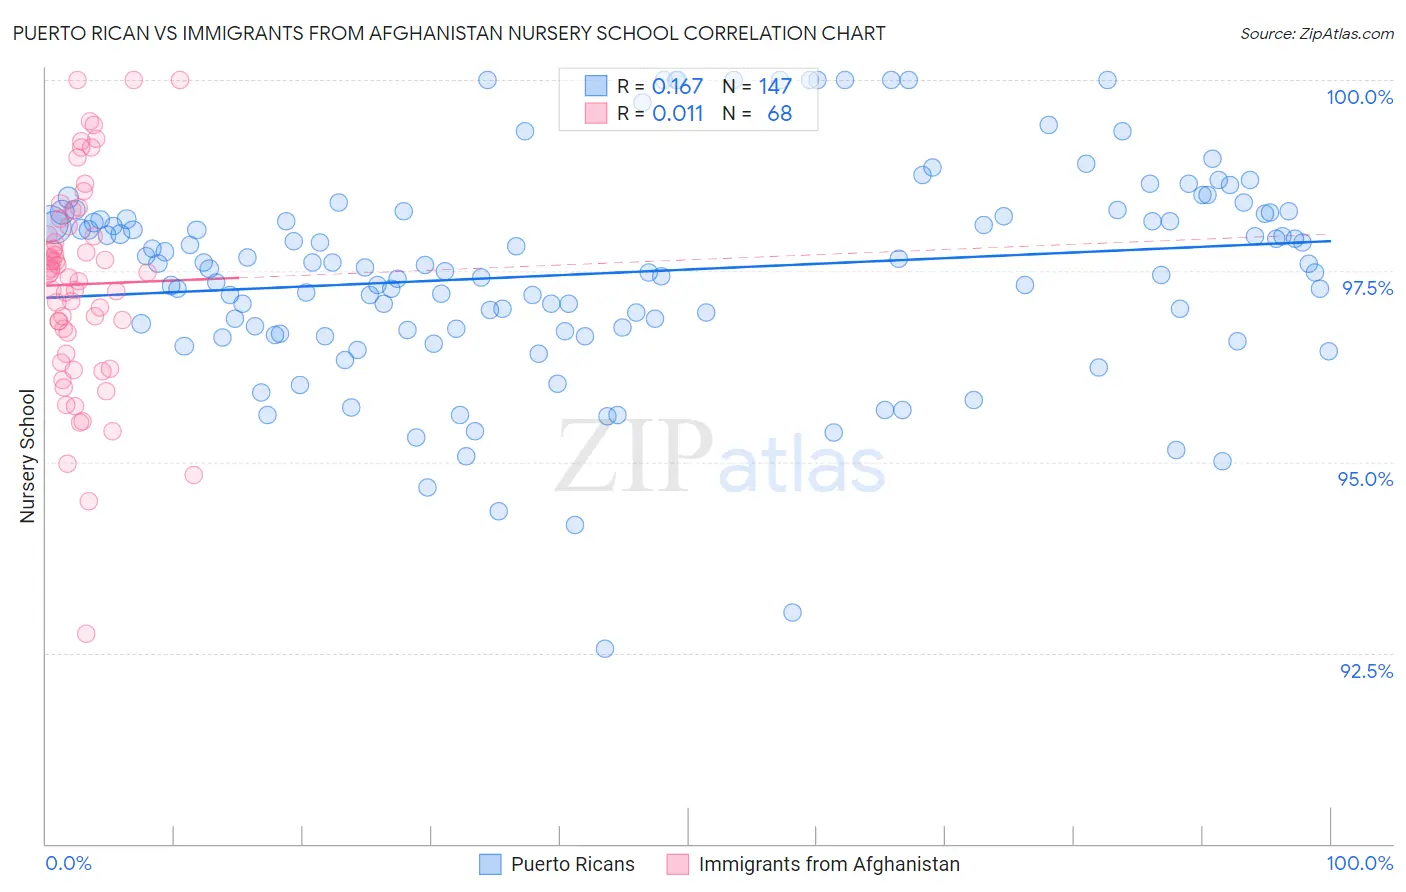
Puerto Rican vs Immigrants from Afghanistan Nursery School Correlation Chart
The statistical analysis conducted on geographies consisting of 528,320,522 people shows a poor positive correlation between the proportion of Puerto Ricans and percentage of population with at least nursery school education in the United States with a correlation coefficient (R) of 0.167 and weighted average of 97.7%. Similarly, the statistical analysis conducted on geographies consisting of 147,629,924 people shows no correlation between the proportion of Immigrants from Afghanistan and percentage of population with at least nursery school education in the United States with a correlation coefficient (R) of 0.011 and weighted average of 97.3%, a difference of 0.40%.
Nursery School Correlation Summary
| Measurement | Puerto Rican | Immigrants from Afghanistan |
| Minimum | 92.6% | 92.8% |
| Maximum | 100.0% | 100.0% |
| Range | 7.4% | 7.2% |
| Mean | 97.5% | 97.3% |
| Median | 97.6% | 97.5% |
| Interquartile 25% (IQ1) | 96.7% | 96.6% |
| Interquartile 75% (IQ3) | 98.2% | 98.0% |
| Interquartile Range (IQR) | 1.5% | 1.5% |
| Standard Deviation (Sample) | 1.4% | 1.4% |
| Standard Deviation (Population) | 1.4% | 1.4% |
Similar Demographics by Nursery School
Demographics Similar to Puerto Ricans by Nursery School
In terms of nursery school, the demographic groups most similar to Puerto Ricans are Sierra Leonean (97.7%, a difference of 0.010%), Immigrants from Uruguay (97.7%, a difference of 0.010%), U.S. Virgin Islander (97.7%, a difference of 0.010%), Immigrants from Costa Rica (97.7%, a difference of 0.020%), and Iraqi (97.7%, a difference of 0.020%).
| Demographics | Rating | Rank | Nursery School |
| Immigrants | Nepal | 3.6 /100 | #224 | Tragic 97.7% |
| Immigrants | Costa Rica | 3.5 /100 | #225 | Tragic 97.7% |
| Iraqis | 3.5 /100 | #226 | Tragic 97.7% |
| Sub-Saharan Africans | 3.2 /100 | #227 | Tragic 97.7% |
| Sudanese | 3.2 /100 | #228 | Tragic 97.7% |
| Senegalese | 3.2 /100 | #229 | Tragic 97.7% |
| Sierra Leoneans | 2.9 /100 | #230 | Tragic 97.7% |
| Puerto Ricans | 2.6 /100 | #231 | Tragic 97.7% |
| Immigrants | Uruguay | 2.3 /100 | #232 | Tragic 97.7% |
| U.S. Virgin Islanders | 2.1 /100 | #233 | Tragic 97.7% |
| Colombians | 2.1 /100 | #234 | Tragic 97.7% |
| Immigrants | Pakistan | 2.1 /100 | #235 | Tragic 97.7% |
| Immigrants | Malaysia | 1.9 /100 | #236 | Tragic 97.7% |
| Immigrants | Western Asia | 1.9 /100 | #237 | Tragic 97.7% |
| Nigerians | 1.7 /100 | #238 | Tragic 97.7% |
Demographics Similar to Immigrants from Afghanistan by Nursery School
In terms of nursery school, the demographic groups most similar to Immigrants from Afghanistan are Immigrants from St. Vincent and the Grenadines (97.3%, a difference of 0.0%), Immigrants from Thailand (97.3%, a difference of 0.010%), Immigrants from Hong Kong (97.4%, a difference of 0.030%), British West Indian (97.3%, a difference of 0.030%), and Immigrants from Barbados (97.4%, a difference of 0.040%).
| Demographics | Rating | Rank | Nursery School |
| Immigrants | West Indies | 0.0 /100 | #283 | Tragic 97.4% |
| Immigrants | Trinidad and Tobago | 0.0 /100 | #284 | Tragic 97.4% |
| Immigrants | Barbados | 0.0 /100 | #285 | Tragic 97.4% |
| Immigrants | Portugal | 0.0 /100 | #286 | Tragic 97.4% |
| Immigrants | Hong Kong | 0.0 /100 | #287 | Tragic 97.4% |
| Immigrants | Thailand | 0.0 /100 | #288 | Tragic 97.3% |
| Immigrants | St. Vincent and the Grenadines | 0.0 /100 | #289 | Tragic 97.3% |
| Immigrants | Afghanistan | 0.0 /100 | #290 | Tragic 97.3% |
| British West Indians | 0.0 /100 | #291 | Tragic 97.3% |
| Houma | 0.0 /100 | #292 | Tragic 97.3% |
| Malaysians | 0.0 /100 | #293 | Tragic 97.3% |
| Immigrants | Grenada | 0.0 /100 | #294 | Tragic 97.3% |
| Immigrants | Immigrants | 0.0 /100 | #295 | Tragic 97.2% |
| Immigrants | Eritrea | 0.0 /100 | #296 | Tragic 97.2% |
| Immigrants | Cuba | 0.0 /100 | #297 | Tragic 97.2% |