Potawatomi vs Peruvian Nursery School
COMPARE
Potawatomi
Peruvian
Nursery School
Nursery School Comparison
Potawatomi
Peruvians
98.3%
NURSERY SCHOOL
99.2/ 100
METRIC RATING
82nd/ 347
METRIC RANK
97.6%
NURSERY SCHOOL
1.0/ 100
METRIC RATING
246th/ 347
METRIC RANK
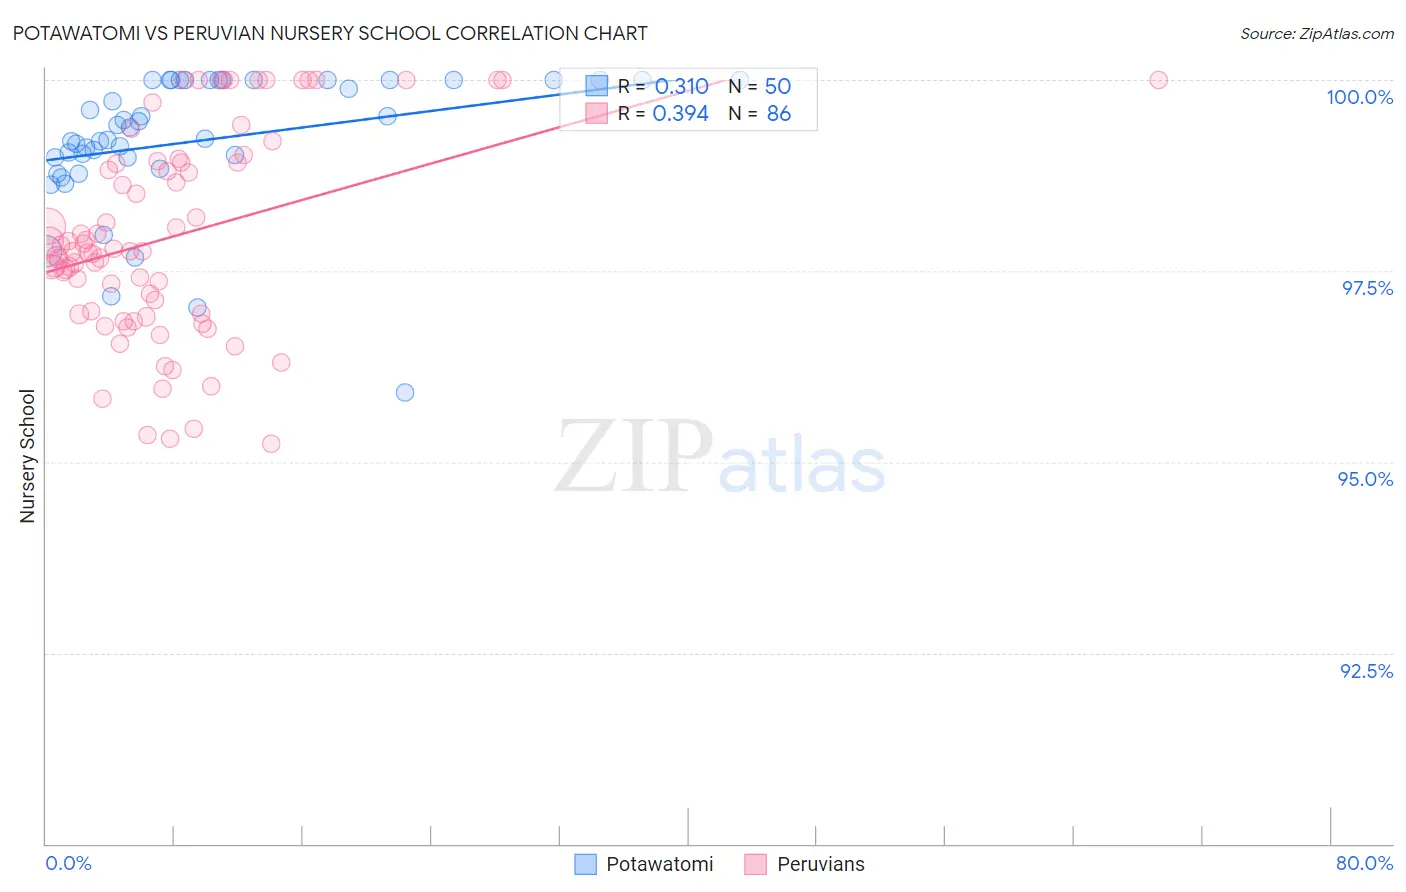
Potawatomi vs Peruvian Nursery School Correlation Chart
The statistical analysis conducted on geographies consisting of 117,769,196 people shows a mild positive correlation between the proportion of Potawatomi and percentage of population with at least nursery school education in the United States with a correlation coefficient (R) of 0.310 and weighted average of 98.3%. Similarly, the statistical analysis conducted on geographies consisting of 363,068,462 people shows a mild positive correlation between the proportion of Peruvians and percentage of population with at least nursery school education in the United States with a correlation coefficient (R) of 0.394 and weighted average of 97.6%, a difference of 0.71%.
Nursery School Correlation Summary
| Measurement | Potawatomi | Peruvian |
| Minimum | 95.9% | 95.2% |
| Maximum | 100.0% | 100.0% |
| Range | 4.1% | 4.8% |
| Mean | 99.2% | 98.0% |
| Median | 99.3% | 97.8% |
| Interquartile 25% (IQ1) | 99.0% | 96.9% |
| Interquartile 75% (IQ3) | 100.0% | 98.9% |
| Interquartile Range (IQR) | 1.0% | 2.0% |
| Standard Deviation (Sample) | 0.89% | 1.3% |
| Standard Deviation (Population) | 0.88% | 1.3% |
Similar Demographics by Nursery School
Demographics Similar to Potawatomi by Nursery School
In terms of nursery school, the demographic groups most similar to Potawatomi are Icelander (98.3%, a difference of 0.0%), Cherokee (98.3%, a difference of 0.010%), Immigrants from England (98.3%, a difference of 0.010%), Immigrants from Lithuania (98.3%, a difference of 0.010%), and Delaware (98.3%, a difference of 0.010%).
| Demographics | Rating | Rank | Nursery School |
| Cherokee | 99.3 /100 | #75 | Exceptional 98.3% |
| Immigrants | England | 99.3 /100 | #76 | Exceptional 98.3% |
| Immigrants | Lithuania | 99.3 /100 | #77 | Exceptional 98.3% |
| Delaware | 99.3 /100 | #78 | Exceptional 98.3% |
| Immigrants | Belgium | 99.3 /100 | #79 | Exceptional 98.3% |
| Shoshone | 99.3 /100 | #80 | Exceptional 98.3% |
| Icelanders | 99.2 /100 | #81 | Exceptional 98.3% |
| Potawatomi | 99.2 /100 | #82 | Exceptional 98.3% |
| Osage | 99.1 /100 | #83 | Exceptional 98.3% |
| Immigrants | Denmark | 99.1 /100 | #84 | Exceptional 98.3% |
| Immigrants | Sweden | 99.1 /100 | #85 | Exceptional 98.3% |
| Immigrants | Australia | 99.0 /100 | #86 | Exceptional 98.3% |
| Hopi | 98.9 /100 | #87 | Exceptional 98.3% |
| Ukrainians | 98.9 /100 | #88 | Exceptional 98.3% |
| Immigrants | South Africa | 98.8 /100 | #89 | Exceptional 98.3% |
Demographics Similar to Peruvians by Nursery School
In terms of nursery school, the demographic groups most similar to Peruvians are South American (97.6%, a difference of 0.0%), Bolivian (97.6%, a difference of 0.0%), Immigrants from Middle Africa (97.6%, a difference of 0.0%), Indian (Asian) (97.6%, a difference of 0.0%), and Immigrants from Indonesia (97.7%, a difference of 0.010%).
| Demographics | Rating | Rank | Nursery School |
| Immigrants | Eastern Asia | 1.6 /100 | #239 | Tragic 97.7% |
| Koreans | 1.4 /100 | #240 | Tragic 97.7% |
| Immigrants | Indonesia | 1.1 /100 | #241 | Tragic 97.7% |
| Liberians | 1.1 /100 | #242 | Tragic 97.7% |
| Asians | 1.1 /100 | #243 | Tragic 97.6% |
| South Americans | 1.0 /100 | #244 | Tragic 97.6% |
| Bolivians | 1.0 /100 | #245 | Tragic 97.6% |
| Peruvians | 1.0 /100 | #246 | Tragic 97.6% |
| Immigrants | Middle Africa | 0.9 /100 | #247 | Tragic 97.6% |
| Indians (Asian) | 0.9 /100 | #248 | Tragic 97.6% |
| Immigrants | Eastern Africa | 0.9 /100 | #249 | Tragic 97.6% |
| Immigrants | Senegal | 0.9 /100 | #250 | Tragic 97.6% |
| Ethiopians | 0.8 /100 | #251 | Tragic 97.6% |
| Immigrants | Africa | 0.8 /100 | #252 | Tragic 97.6% |
| Immigrants | Iraq | 0.7 /100 | #253 | Tragic 97.6% |