Potawatomi vs Choctaw 5th Grade
COMPARE
Potawatomi
Choctaw
5th Grade
5th Grade Comparison
Potawatomi
Choctaw
97.8%
5TH GRADE
99.0/ 100
METRIC RATING
84th/ 347
METRIC RANK
97.7%
5TH GRADE
98.0/ 100
METRIC RATING
102nd/ 347
METRIC RANK
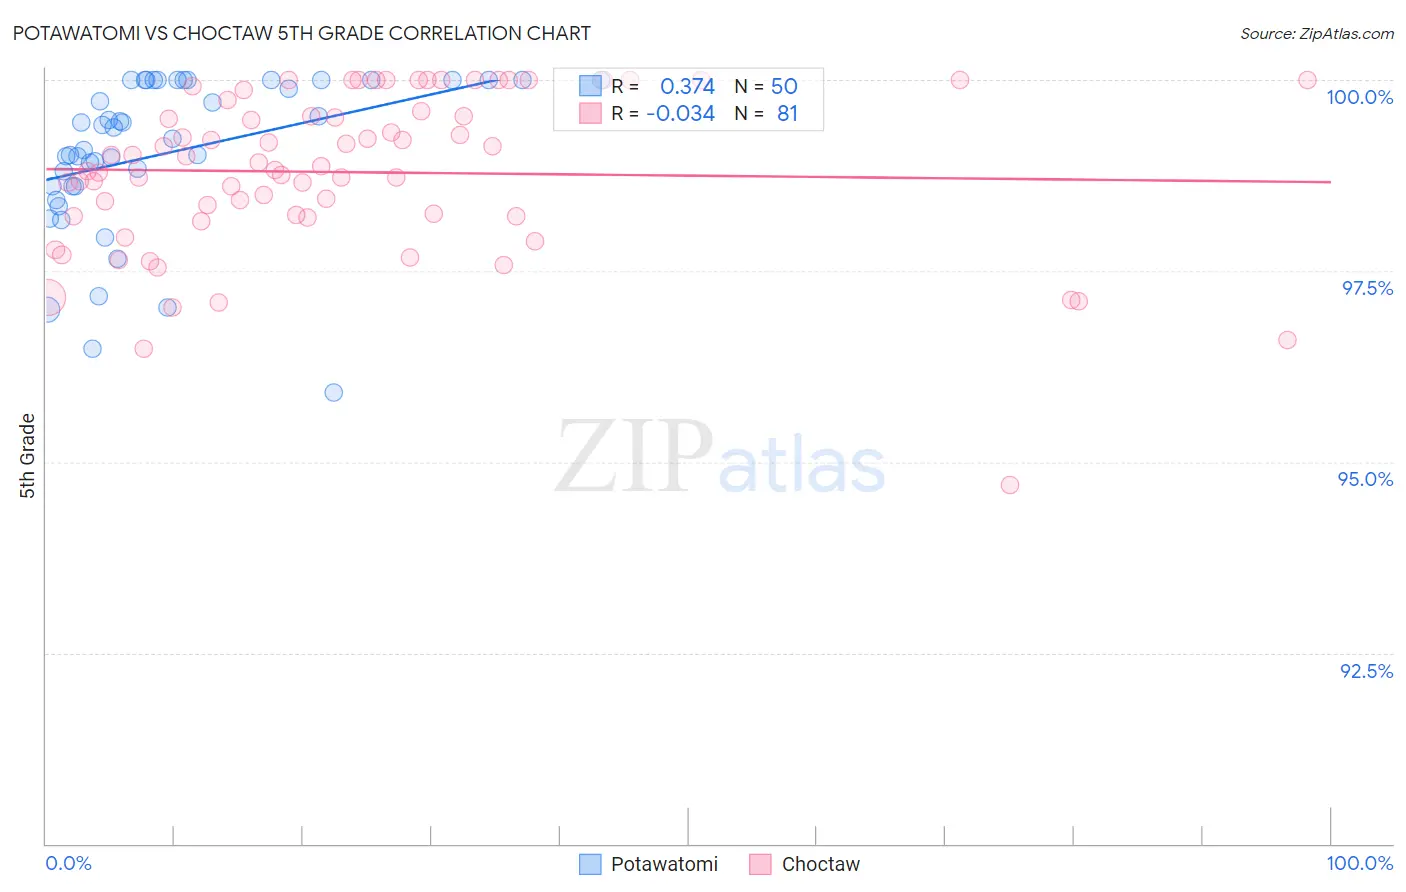
Potawatomi vs Choctaw 5th Grade Correlation Chart
The statistical analysis conducted on geographies consisting of 117,769,196 people shows a mild positive correlation between the proportion of Potawatomi and percentage of population with at least 5th grade education in the United States with a correlation coefficient (R) of 0.374 and weighted average of 97.8%. Similarly, the statistical analysis conducted on geographies consisting of 269,742,875 people shows no correlation between the proportion of Choctaw and percentage of population with at least 5th grade education in the United States with a correlation coefficient (R) of -0.034 and weighted average of 97.7%, a difference of 0.070%.
5th Grade Correlation Summary
| Measurement | Potawatomi | Choctaw |
| Minimum | 95.9% | 94.7% |
| Maximum | 100.0% | 100.0% |
| Range | 4.1% | 5.3% |
| Mean | 99.0% | 98.8% |
| Median | 99.3% | 98.9% |
| Interquartile 25% (IQ1) | 98.6% | 98.2% |
| Interquartile 75% (IQ3) | 100.0% | 99.7% |
| Interquartile Range (IQR) | 1.4% | 1.4% |
| Standard Deviation (Sample) | 1.0% | 1.0% |
| Standard Deviation (Population) | 1.0% | 1.0% |
Demographics Similar to Potawatomi and Choctaw by 5th Grade
In terms of 5th grade, the demographic groups most similar to Potawatomi are Zimbabwean (97.8%, a difference of 0.0%), Immigrants from Belgium (97.8%, a difference of 0.0%), Cypriot (97.8%, a difference of 0.010%), Immigrants from Australia (97.8%, a difference of 0.020%), and Shoshone (97.8%, a difference of 0.020%). Similarly, the demographic groups most similar to Choctaw are Cheyenne (97.7%, a difference of 0.0%), Yugoslavian (97.7%, a difference of 0.020%), Turkish (97.7%, a difference of 0.020%), Puget Sound Salish (97.7%, a difference of 0.020%), and South African (97.7%, a difference of 0.020%).
| Demographics | Rating | Rank | 5th Grade |
| Zimbabweans | 99.0 /100 | #83 | Exceptional 97.8% |
| Potawatomi | 99.0 /100 | #84 | Exceptional 97.8% |
| Immigrants | Belgium | 99.0 /100 | #85 | Exceptional 97.8% |
| Cypriots | 98.9 /100 | #86 | Exceptional 97.8% |
| Immigrants | Australia | 98.8 /100 | #87 | Exceptional 97.8% |
| Shoshone | 98.8 /100 | #88 | Exceptional 97.8% |
| Immigrants | South Africa | 98.8 /100 | #89 | Exceptional 97.8% |
| Immigrants | Ireland | 98.8 /100 | #90 | Exceptional 97.8% |
| Immigrants | Western Europe | 98.8 /100 | #91 | Exceptional 97.8% |
| Immigrants | Sweden | 98.7 /100 | #92 | Exceptional 97.8% |
| Delaware | 98.6 /100 | #93 | Exceptional 97.8% |
| Immigrants | Denmark | 98.6 /100 | #94 | Exceptional 97.8% |
| Romanians | 98.6 /100 | #95 | Exceptional 97.8% |
| Immigrants | Germany | 98.5 /100 | #96 | Exceptional 97.8% |
| Cree | 98.4 /100 | #97 | Exceptional 97.7% |
| Yugoslavians | 98.3 /100 | #98 | Exceptional 97.7% |
| Turks | 98.3 /100 | #99 | Exceptional 97.7% |
| Puget Sound Salish | 98.3 /100 | #100 | Exceptional 97.7% |
| South Africans | 98.3 /100 | #101 | Exceptional 97.7% |
| Choctaw | 98.0 /100 | #102 | Exceptional 97.7% |
| Cheyenne | 97.9 /100 | #103 | Exceptional 97.7% |